 9
9peptides
spectra
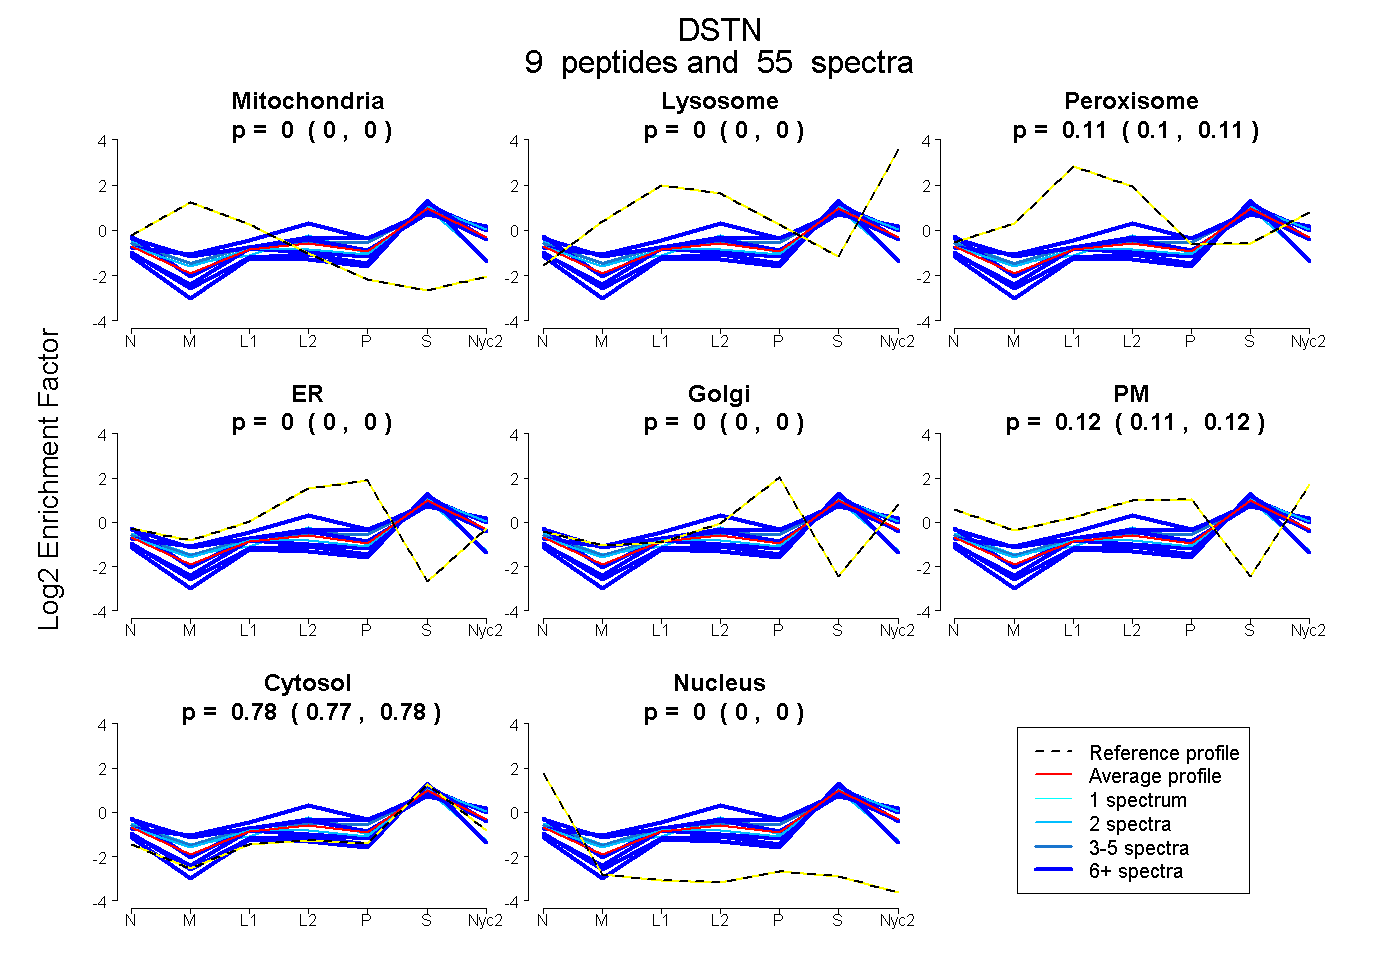
0.000 | 0.000
0.000 | 0.000
0.098 | 0.114
0.000 | 0.000
0.000 | 0.000
0.109 | 0.125
0.769 | 0.781
0.000 | 0.000
4peptides
spectra
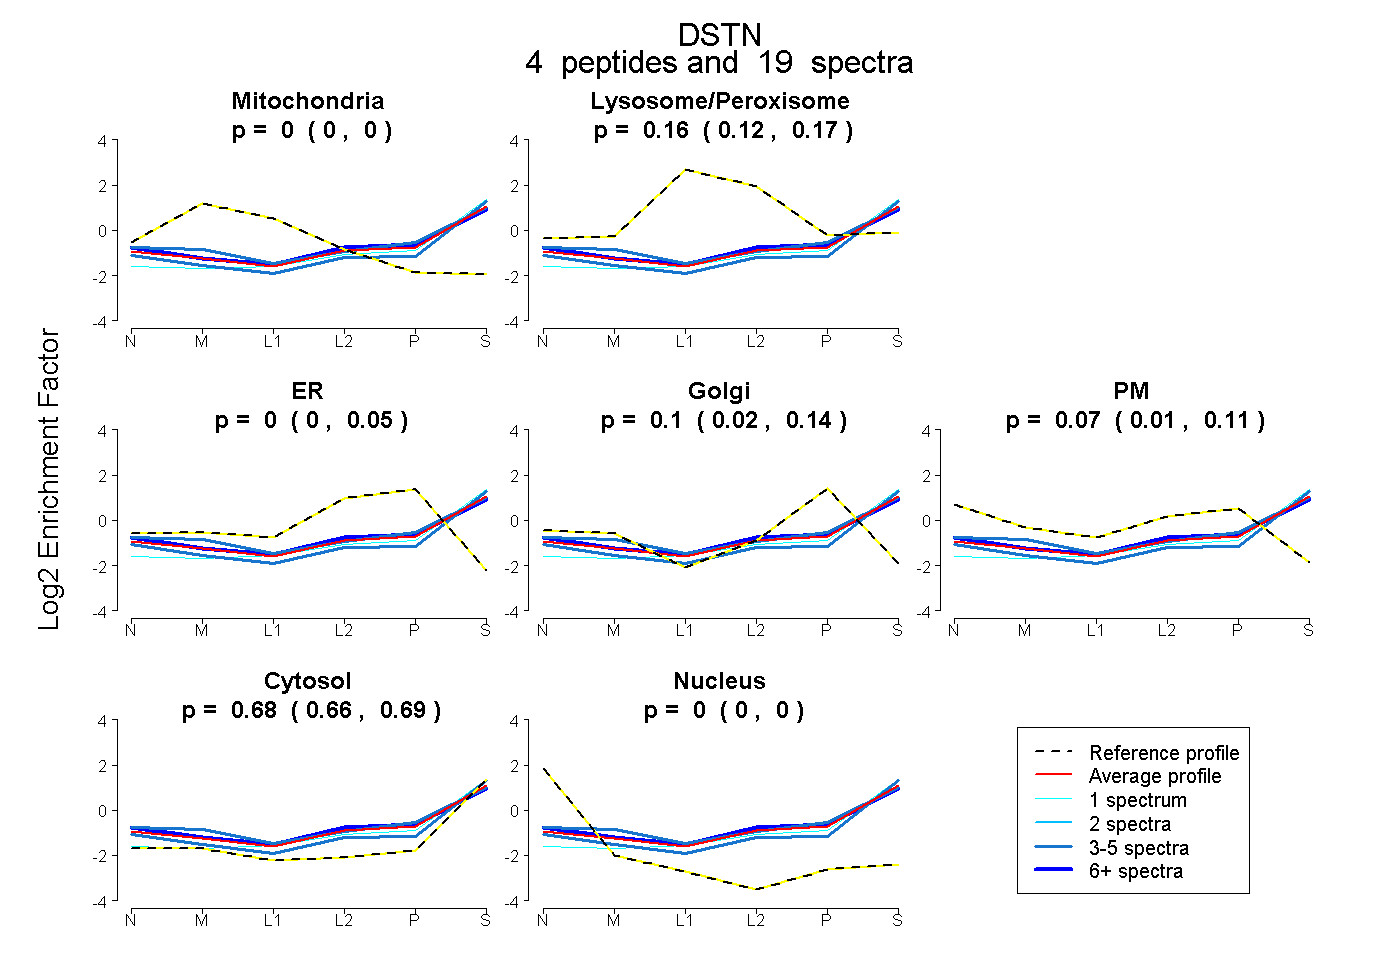
0.000 | 0.000
0.124 | 0.172
0.000 | 0.053
0.020 | 0.139
0.012 | 0.115
0.660 | 0.693
0.000 | 0.000
7peptides
spectra
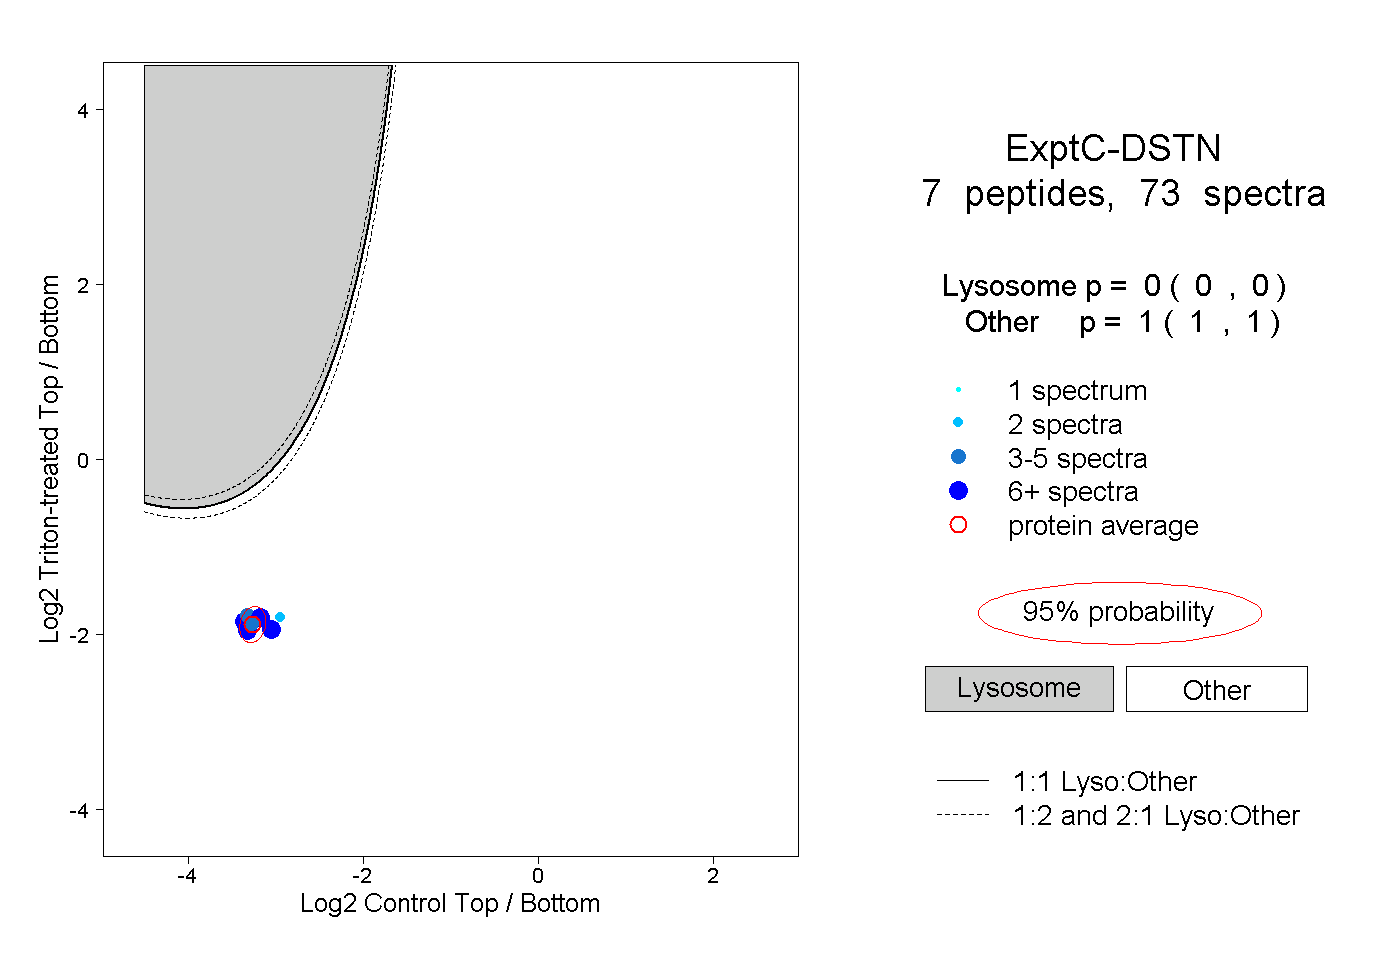
0.000 | 0.000
1.000 | 1.000
4peptides
spectra
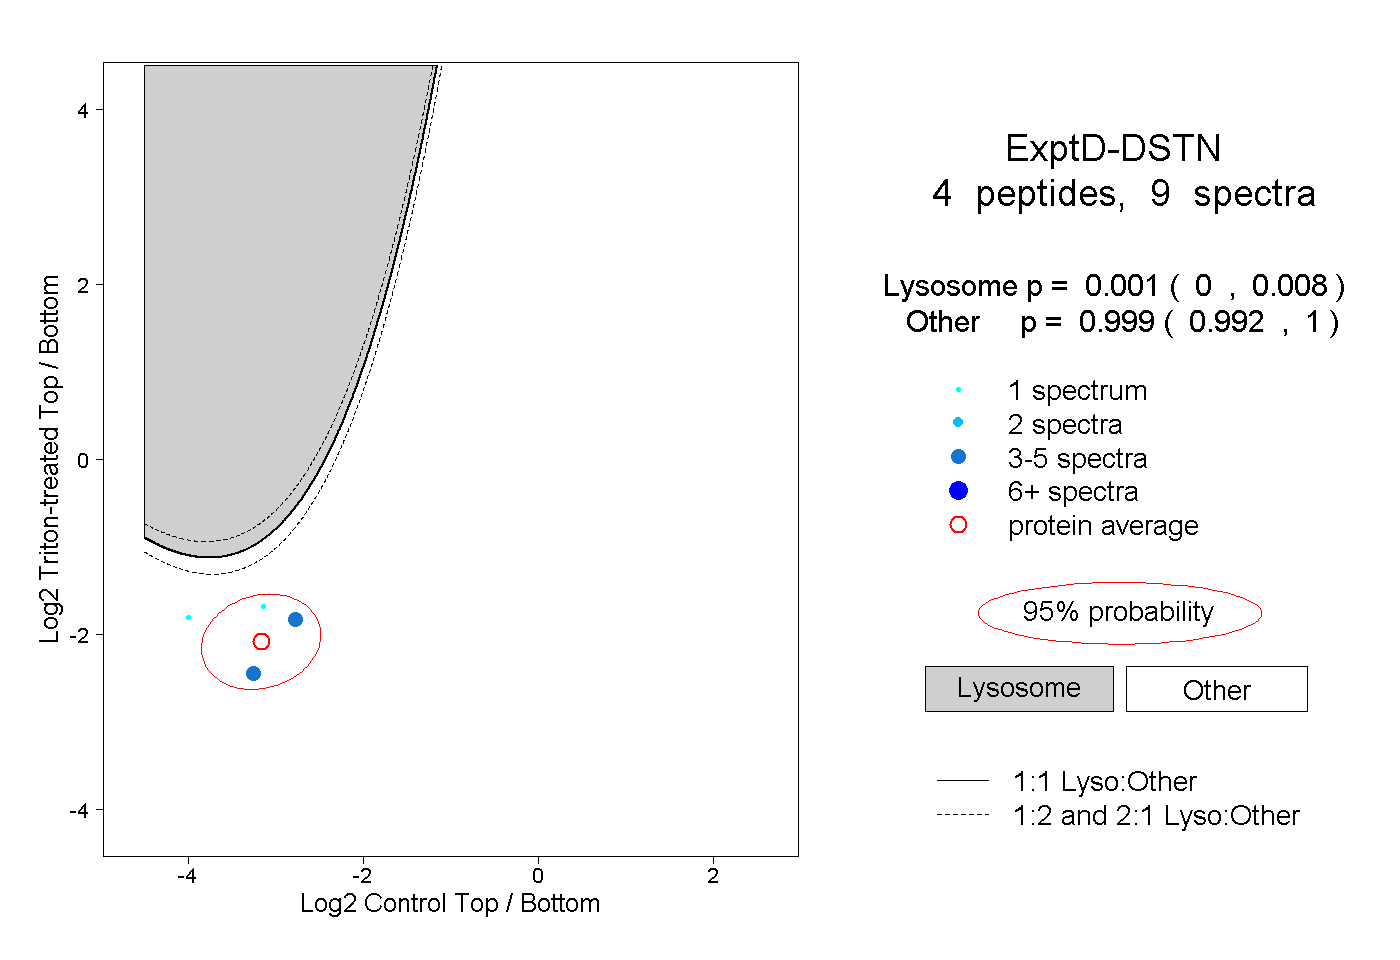
0.000 | 0.008
0.992 | 1.000