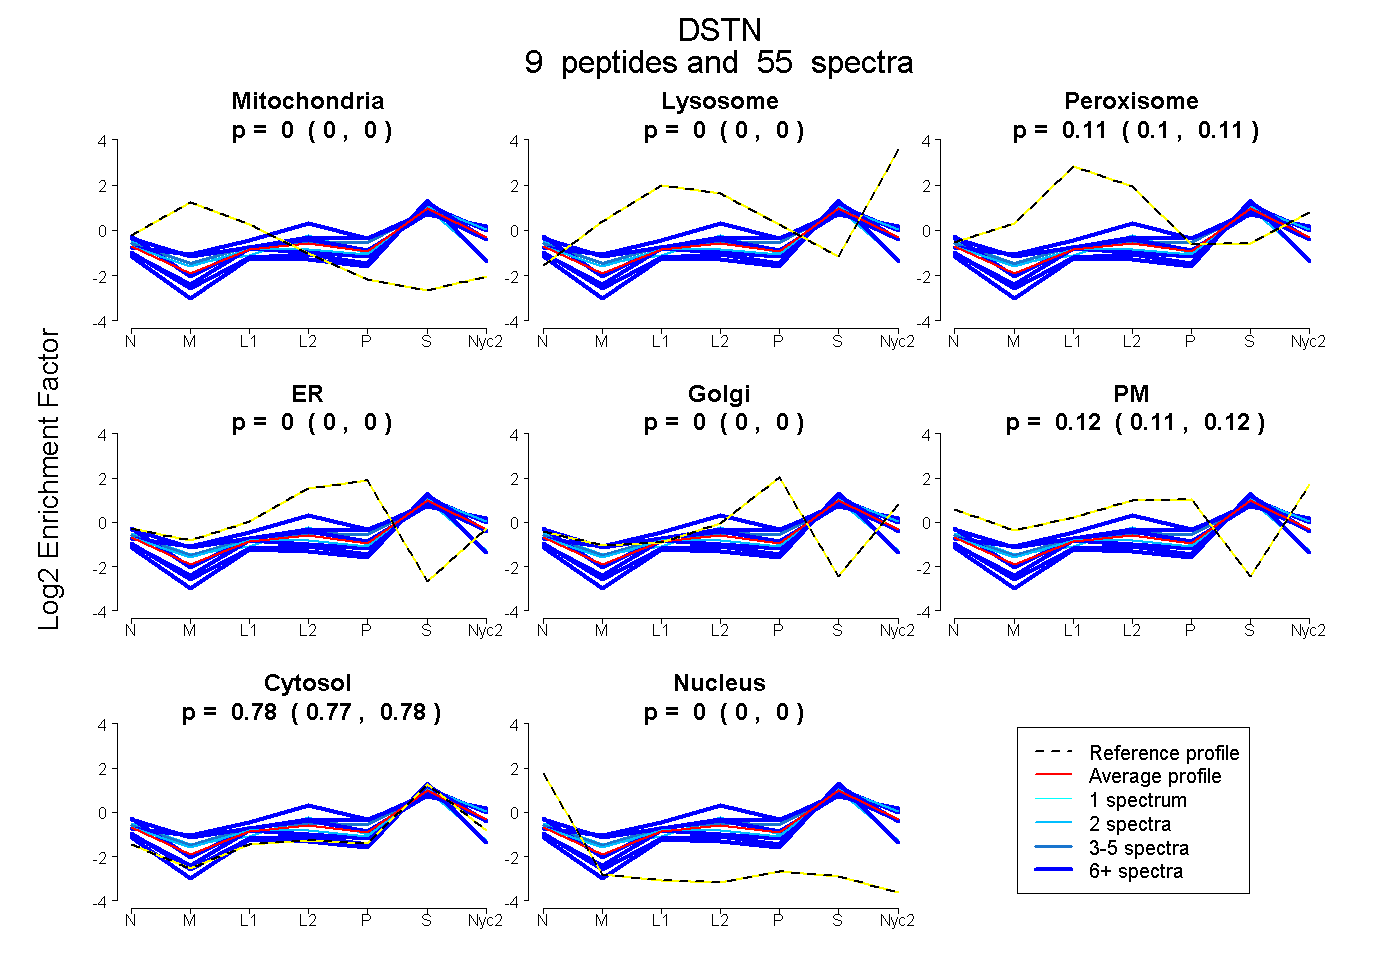
 9
9peptides
spectra
0.000 | 0.000
0.000 | 0.000
0.098 | 0.114
0.000 | 0.000
0.000 | 0.000
0.109 | 0.125
0.769 | 0.781
0.000 | 0.000
| Plot | Mito | Lyso | Perox | ER | Golgi | PM | Cytosol | Nucleus | |||||
| Expt A |
9 peptides |
55 spectra |
|
0.000 0.000 | 0.000 |
0.000 0.000 | 0.000 |
0.107 0.098 | 0.114 |
0.000 0.000 | 0.000 |
0.000 0.000 | 0.000 |
0.118 0.109 | 0.125 |
0.776 0.769 | 0.781 |
0.000 0.000 | 0.000 |
| 6 spectra, LGGSLIVAFEGSPV | 0.000 | 0.000 | 0.147 | 0.000 | 0.000 | 0.207 | 0.646 | 0.000 | ||
| 2 spectra, ASGVQVADEVCR | 0.045 | 0.000 | 0.131 | 0.074 | 0.000 | 0.000 | 0.706 | 0.043 | ||
| 2 spectra, TSIAEK | 0.000 | 0.064 | 0.079 | 0.000 | 0.000 | 0.086 | 0.772 | 0.000 | ||
| 14 spectra, HEYQANGPEDLNR | 0.000 | 0.000 | 0.068 | 0.062 | 0.000 | 0.164 | 0.706 | 0.000 | ||
| 7 spectra, YALYDASFETK | 0.000 | 0.004 | 0.031 | 0.000 | 0.000 | 0.033 | 0.932 | 0.000 | ||
| 6 spectra, HFVGMLPEK | 0.000 | 0.080 | 0.187 | 0.047 | 0.000 | 0.121 | 0.565 | 0.000 | ||
| 5 spectra, CSTPEEIK | 0.000 | 0.039 | 0.086 | 0.000 | 0.000 | 0.193 | 0.682 | 0.000 | ||
| 6 spectra, CIVVEEGK | 0.000 | 0.000 | 0.000 | 0.000 | 0.000 | 0.000 | 0.948 | 0.052 | ||
| 7 spectra, MIYASSK | 0.000 | 0.113 | 0.006 | 0.000 | 0.000 | 0.026 | 0.855 | 0.000 |
| Plot | Mito | Lyso or Perox | ER | Golgi | PM | Cytosol | Nucleus | ||||||
| Expt B |
4 peptides |
19 spectra |
 |
0.000 0.000 | 0.000 |
0.155 0.124 | 0.172 |
0.000 0.000 | 0.053 |
0.103 0.020 | 0.139 |
0.066 0.012 | 0.115 |
0.675 0.660 | 0.693 |
0.000 0.000 | 0.000 |
|||
| Plot | Lyso | Other | |||||||||||
| Expt C |
7 peptides |
73 spectra |
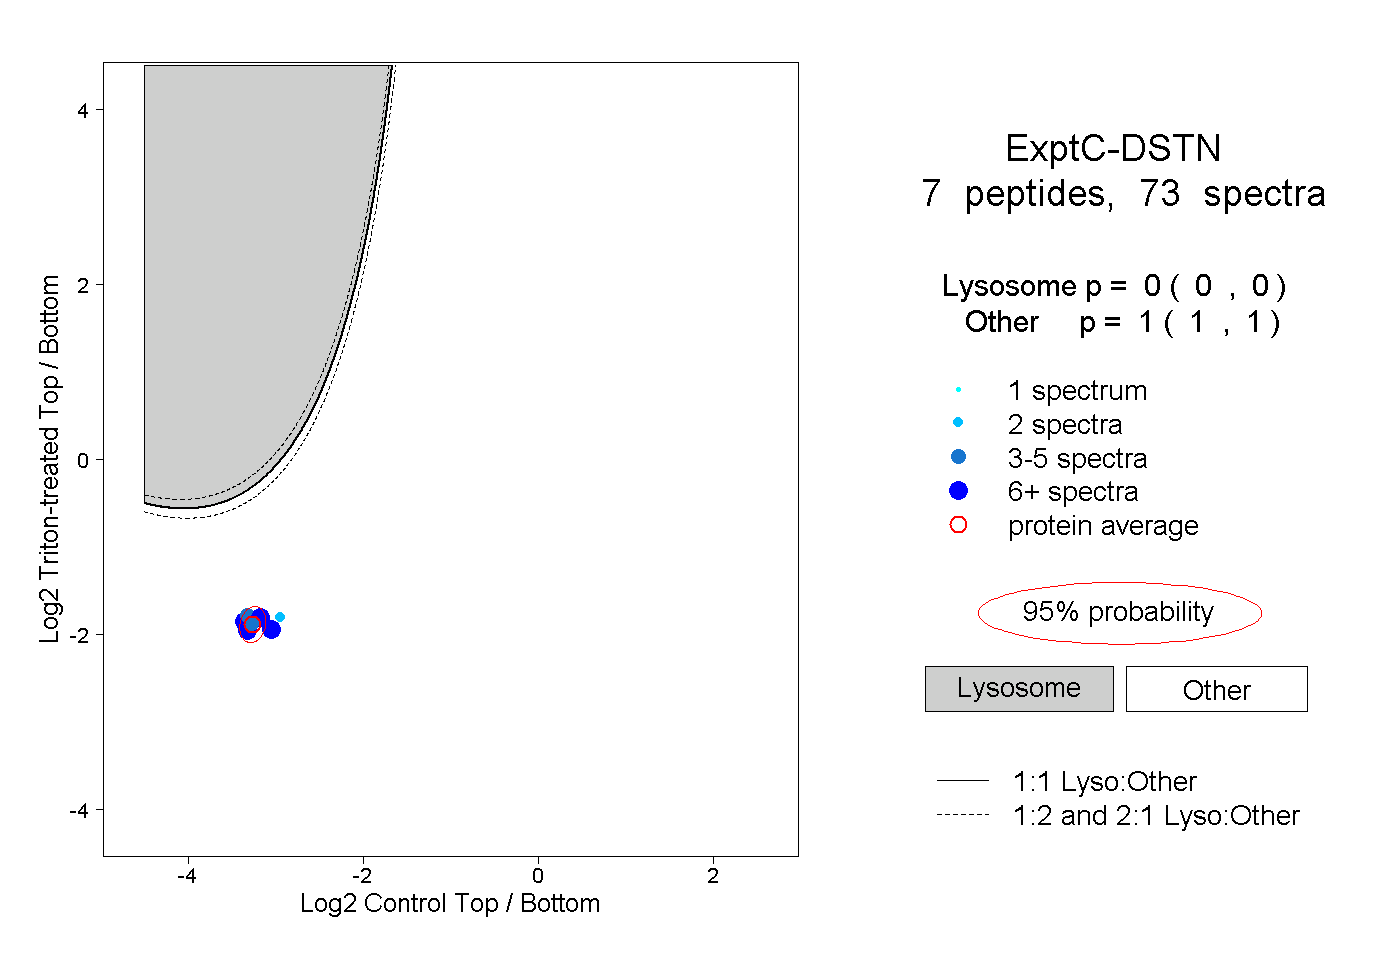 |
0.000 0.000 | 0.000 |
1.000 1.000 | 1.000 |
||||||||
| Plot | Lyso | Other | |||||||||||
| Expt D |
4 peptides |
9 spectra |
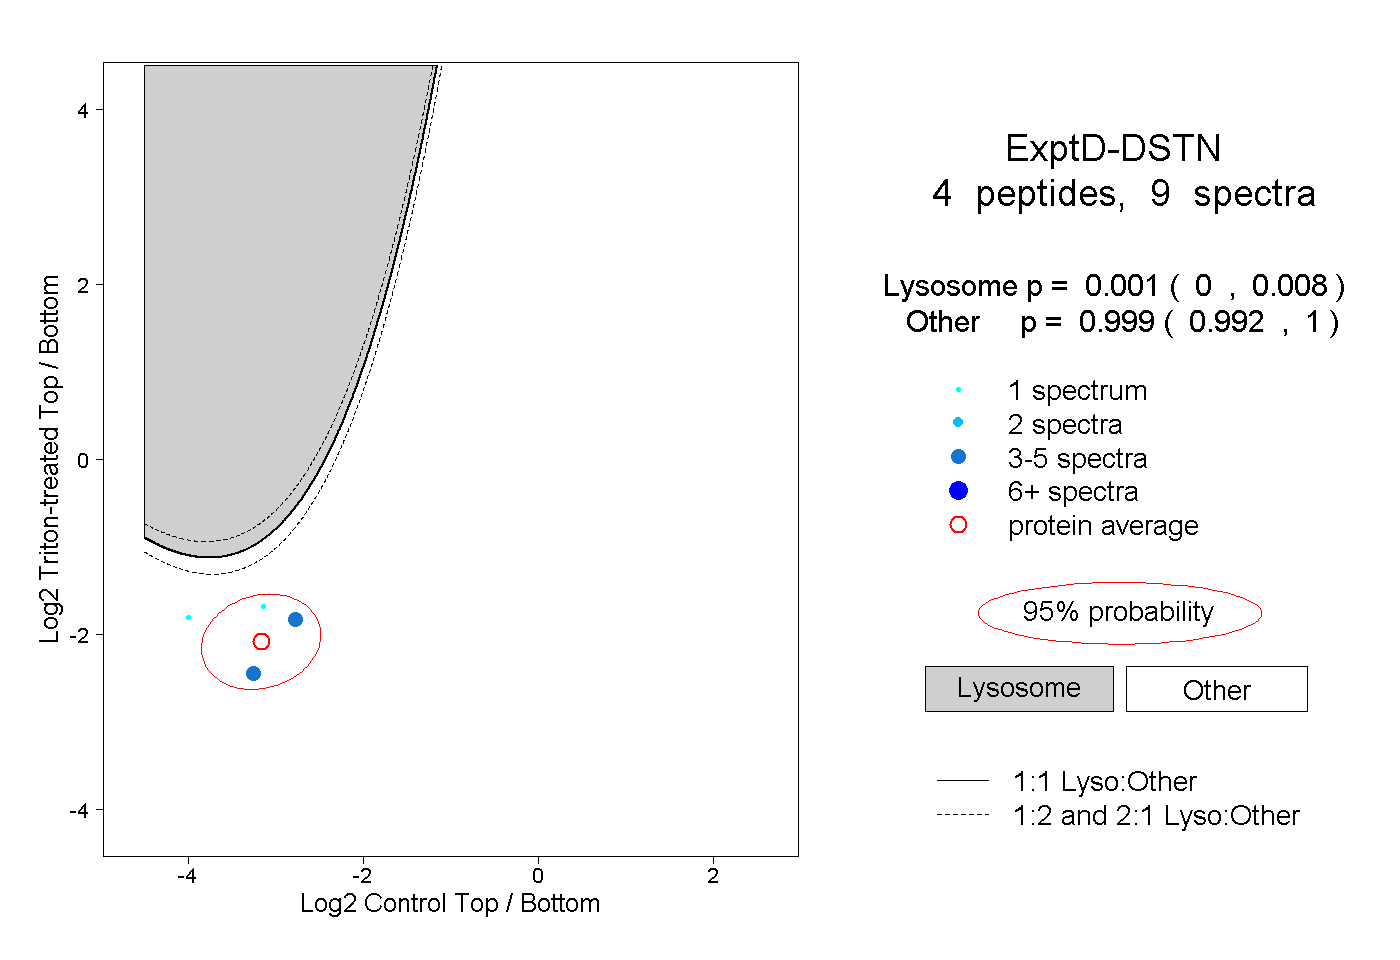 |
0.001 0.000 | 0.008 |
0.999 0.992 | 1.000 |