 6
6peptides
spectra
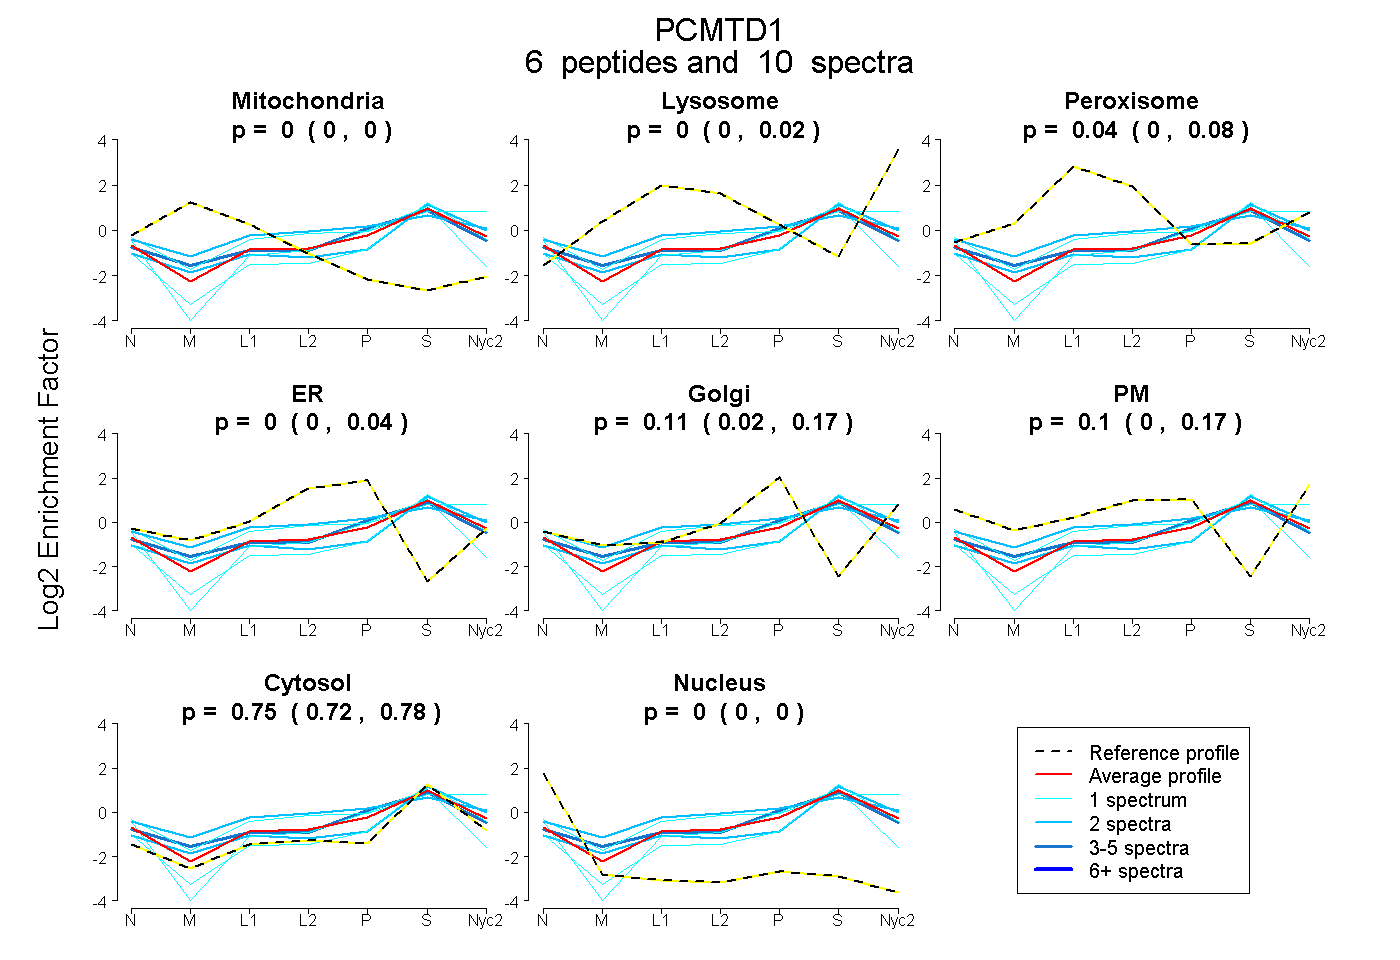
0.000 | 0.000
0.000 | 0.016
0.000 | 0.084
0.000 | 0.039
0.020 | 0.167
0.001 | 0.174
0.720 | 0.777
0.000 | 0.000
1peptide
spectrum
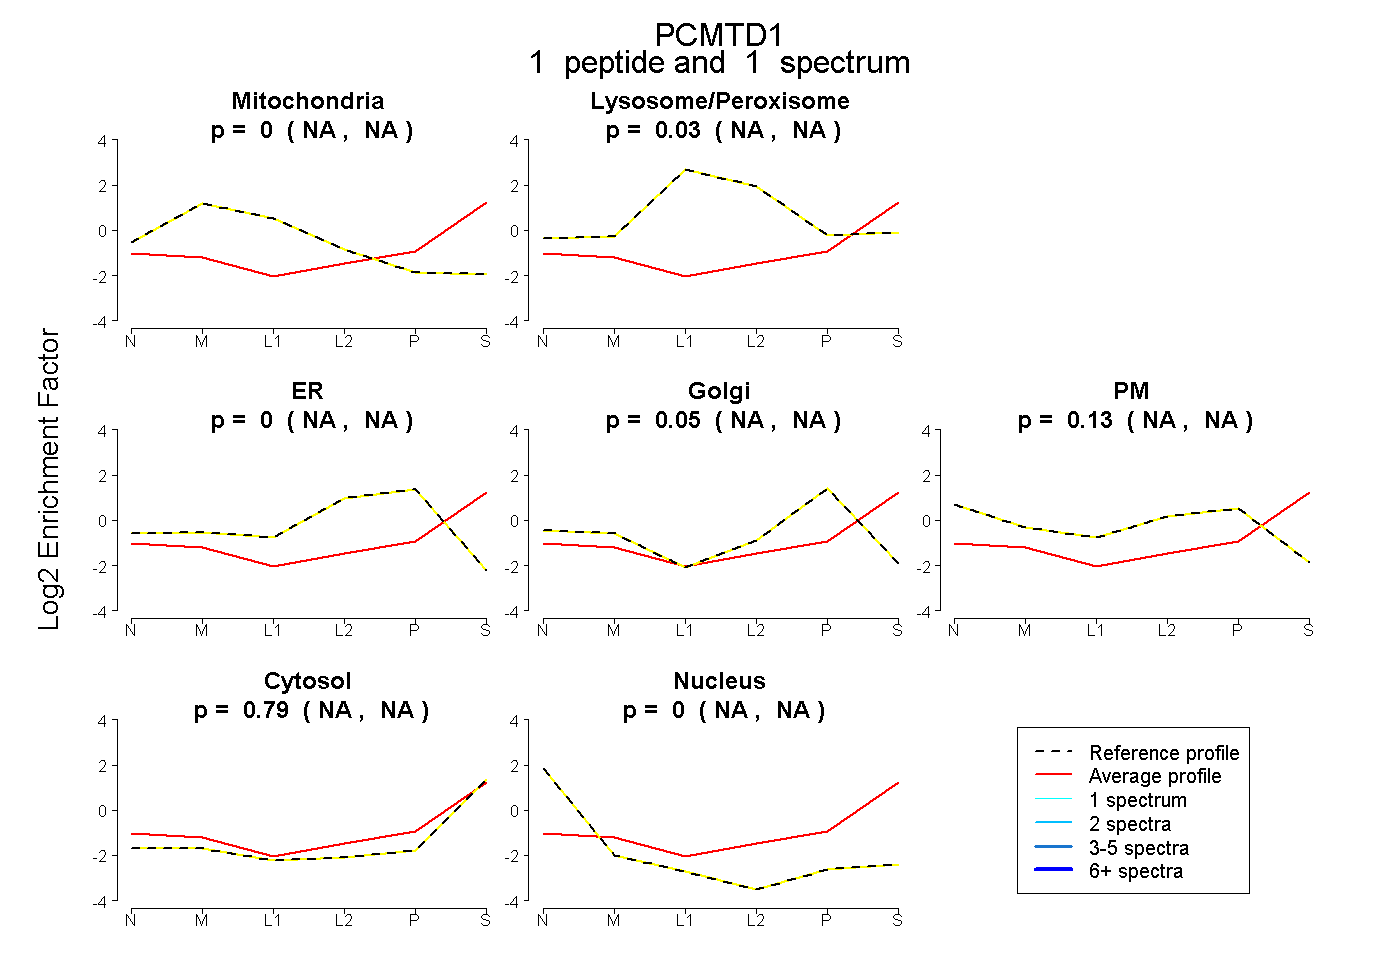
NA | NA
NA | NA
NA | NA
NA | NA
NA | NA
NA | NA
NA | NA
2peptides
spectra
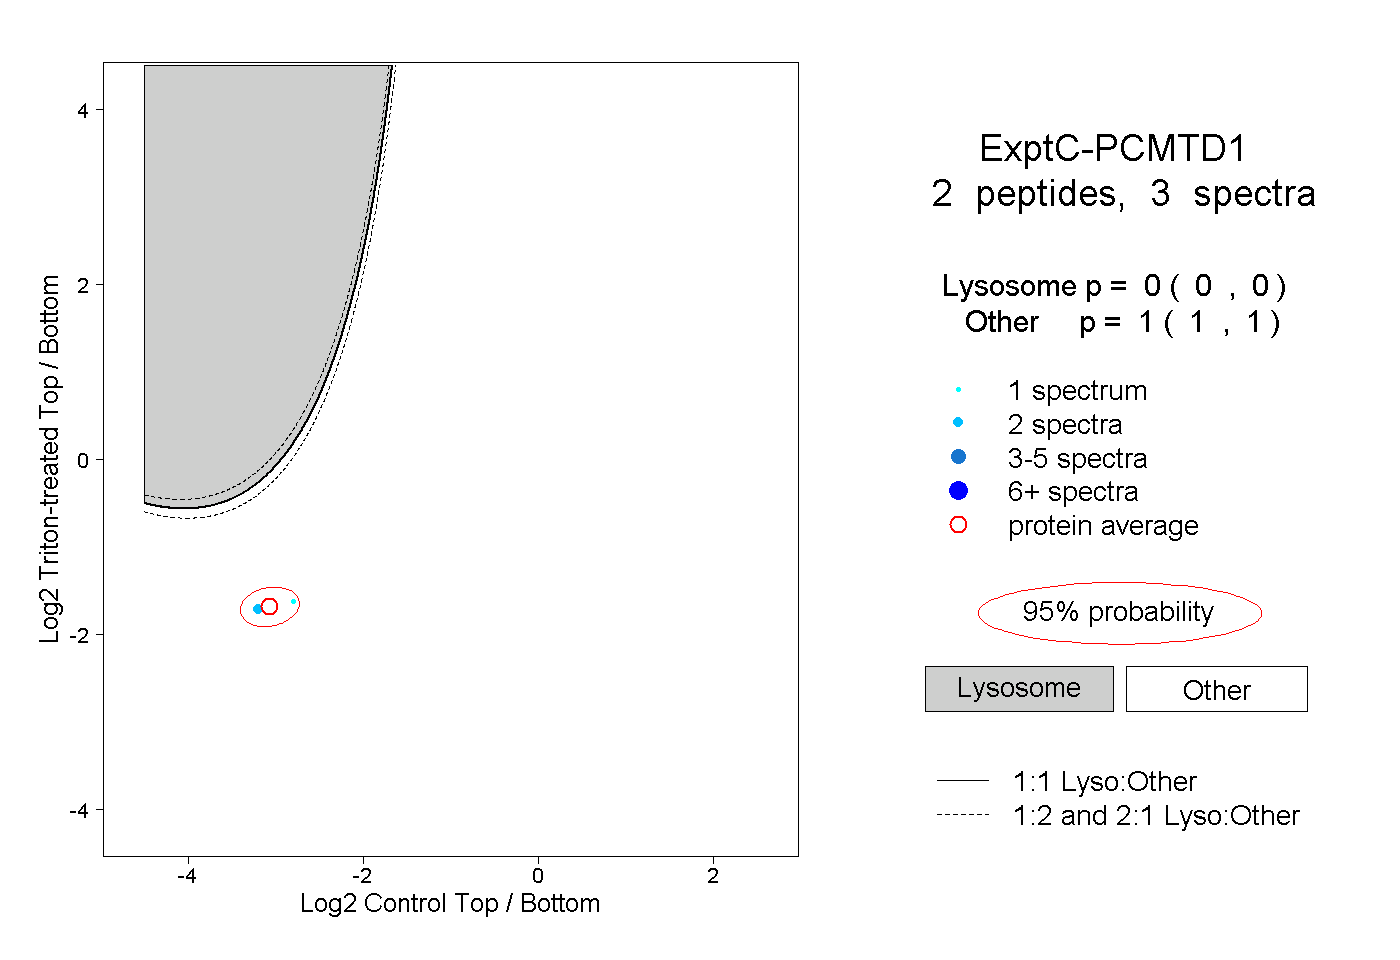
0.000 | 0.000
1.000 | 1.000