 6
6peptides
spectra
0.000 | 0.000
0.000 | 0.016
0.000 | 0.084
0.000 | 0.039
0.020 | 0.167
0.001 | 0.174
0.720 | 0.777
0.000 | 0.000
| Plot | Mito | Lyso | Perox | ER | Golgi | PM | Cytosol | Nucleus | |||||
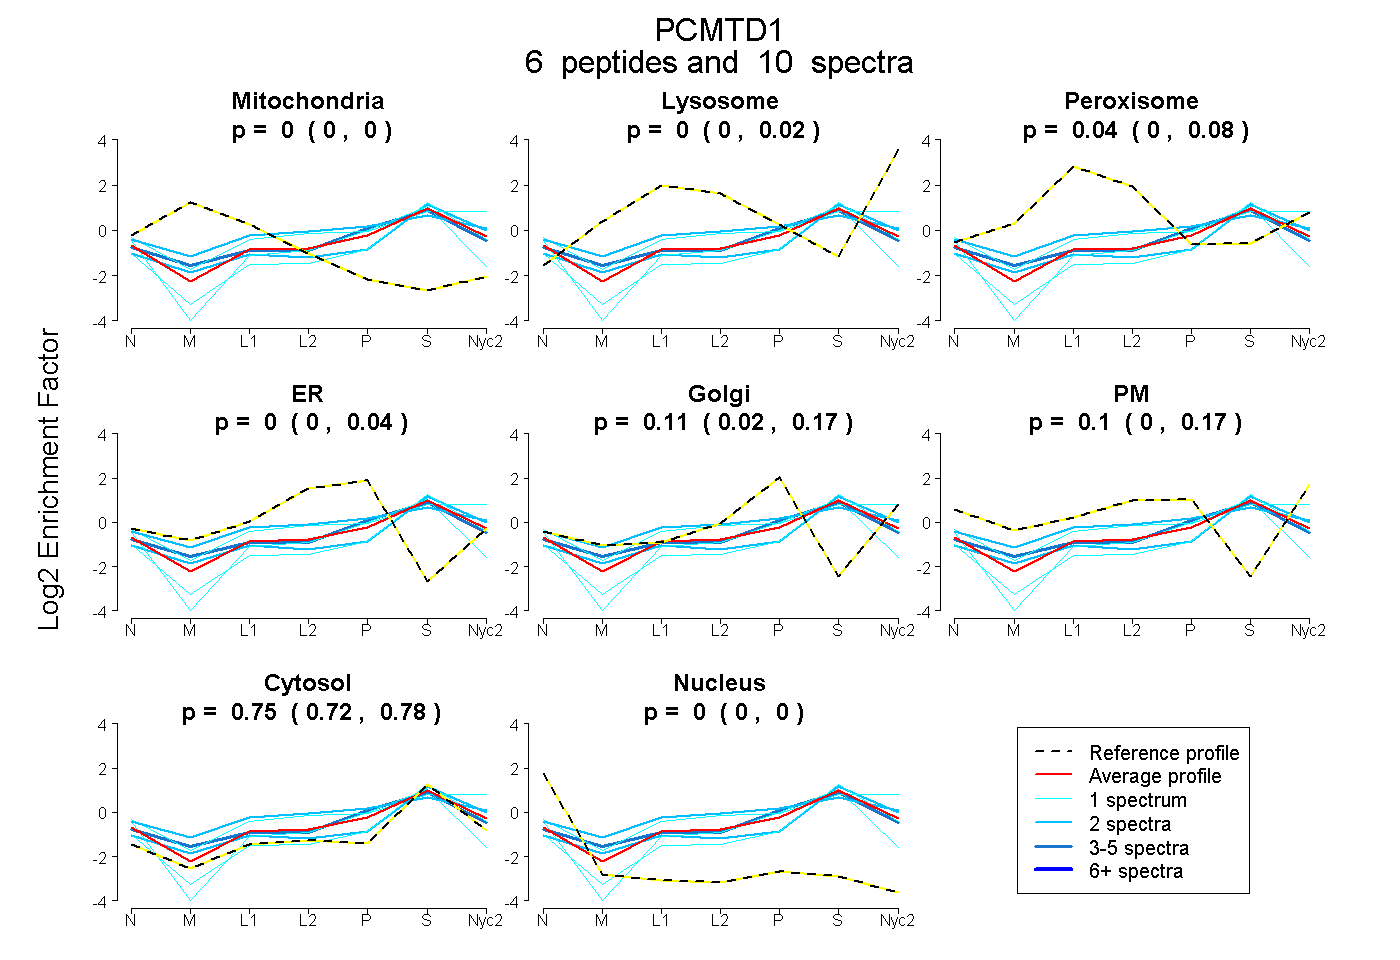
| Expt A |
6 peptides |
10 spectra |
|
0.000 0.000 | 0.000 |
0.000 0.000 | 0.016 |
0.045 0.000 | 0.084 |
0.000 0.000 | 0.039 |
0.105 0.020 | 0.167 |
0.100 0.001 | 0.174 |
0.750 0.720 | 0.777 |
0.000 0.000 | 0.000 |
| 2 spectra, EAQYIR | 0.000 | 0.099 | 0.000 | 0.000 | 0.000 | 0.062 | 0.839 | 0.000 | ||
| 1 spectrum, NLQDLAR | 0.000 | 0.000 | 0.000 | 0.000 | 0.050 | 0.000 | 0.950 | 0.000 | ||
| 1 spectrum, LPLPESLK | 0.000 | 0.000 | 0.000 | 0.115 | 0.000 | 0.000 | 0.819 | 0.067 | ||
| 1 spectrum, NFINDEMQAK | 0.000 | 0.168 | 0.000 | 0.000 | 0.000 | 0.237 | 0.595 | 0.000 | ||
| 2 spectra, TGQNTWESK | 0.000 | 0.000 | 0.243 | 0.000 | 0.164 | 0.090 | 0.503 | 0.000 | ||
| 3 spectra, GDYYLEGYR | 0.000 | 0.000 | 0.084 | 0.000 | 0.239 | 0.000 | 0.677 | 0.000 |
| Plot | Mito | Lyso or Perox | ER | Golgi | PM | Cytosol | Nucleus | ||||||
| Expt B |
1 peptide |
1 spectrum |
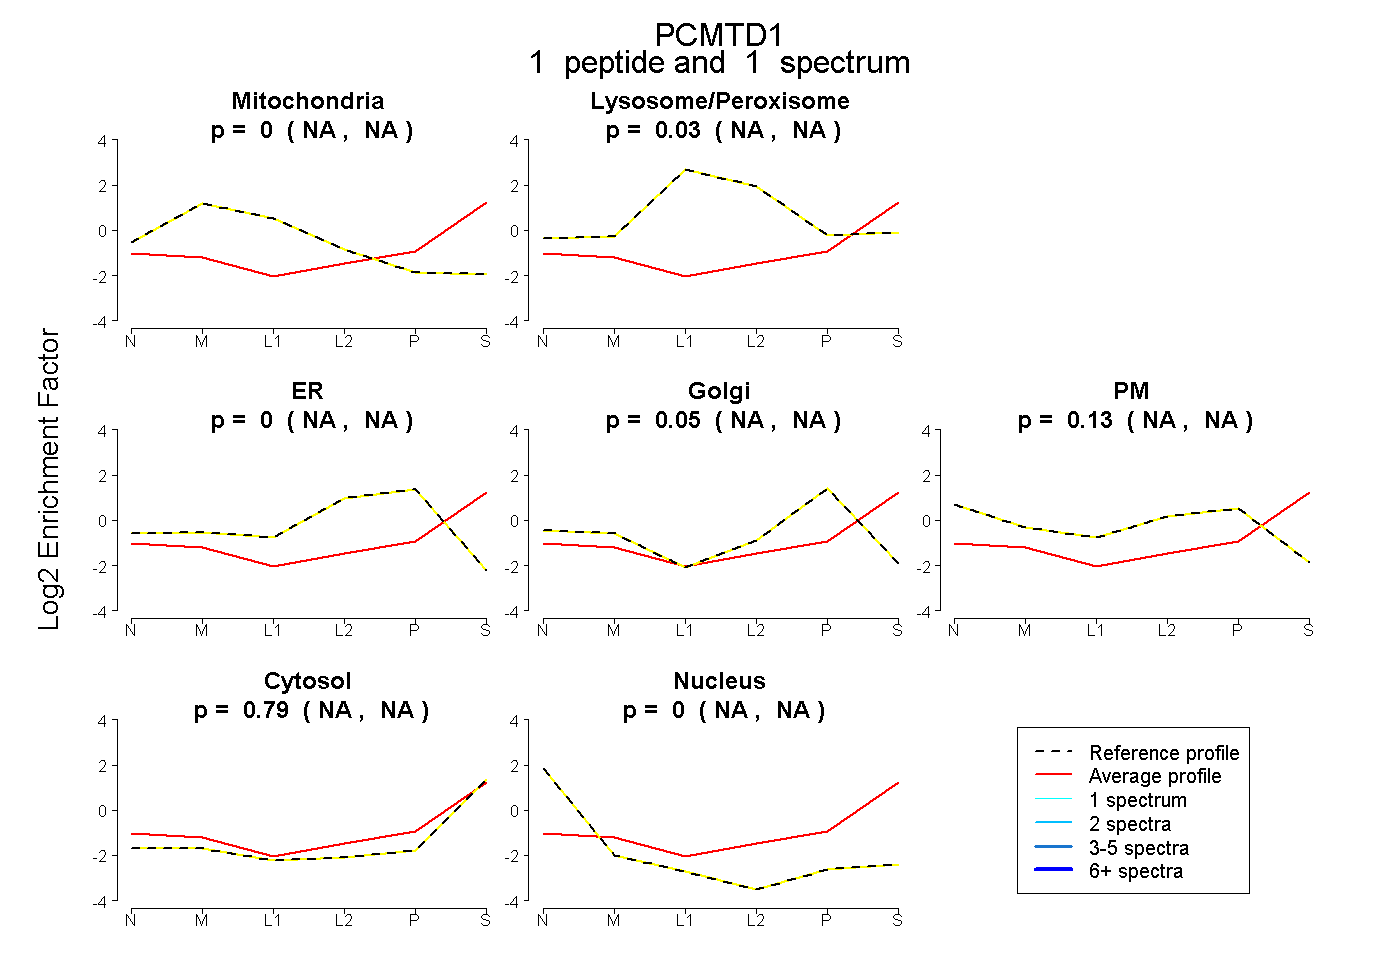 |
0.000 NA | NA |
0.032 NA | NA |
0.000 NA | NA |
0.050 NA | NA |
0.133 NA | NA |
0.785 NA | NA |
0.000 NA | NA |
|||
| Plot | Lyso | Other | |||||||||||
| Expt C |
2 peptides |
3 spectra |
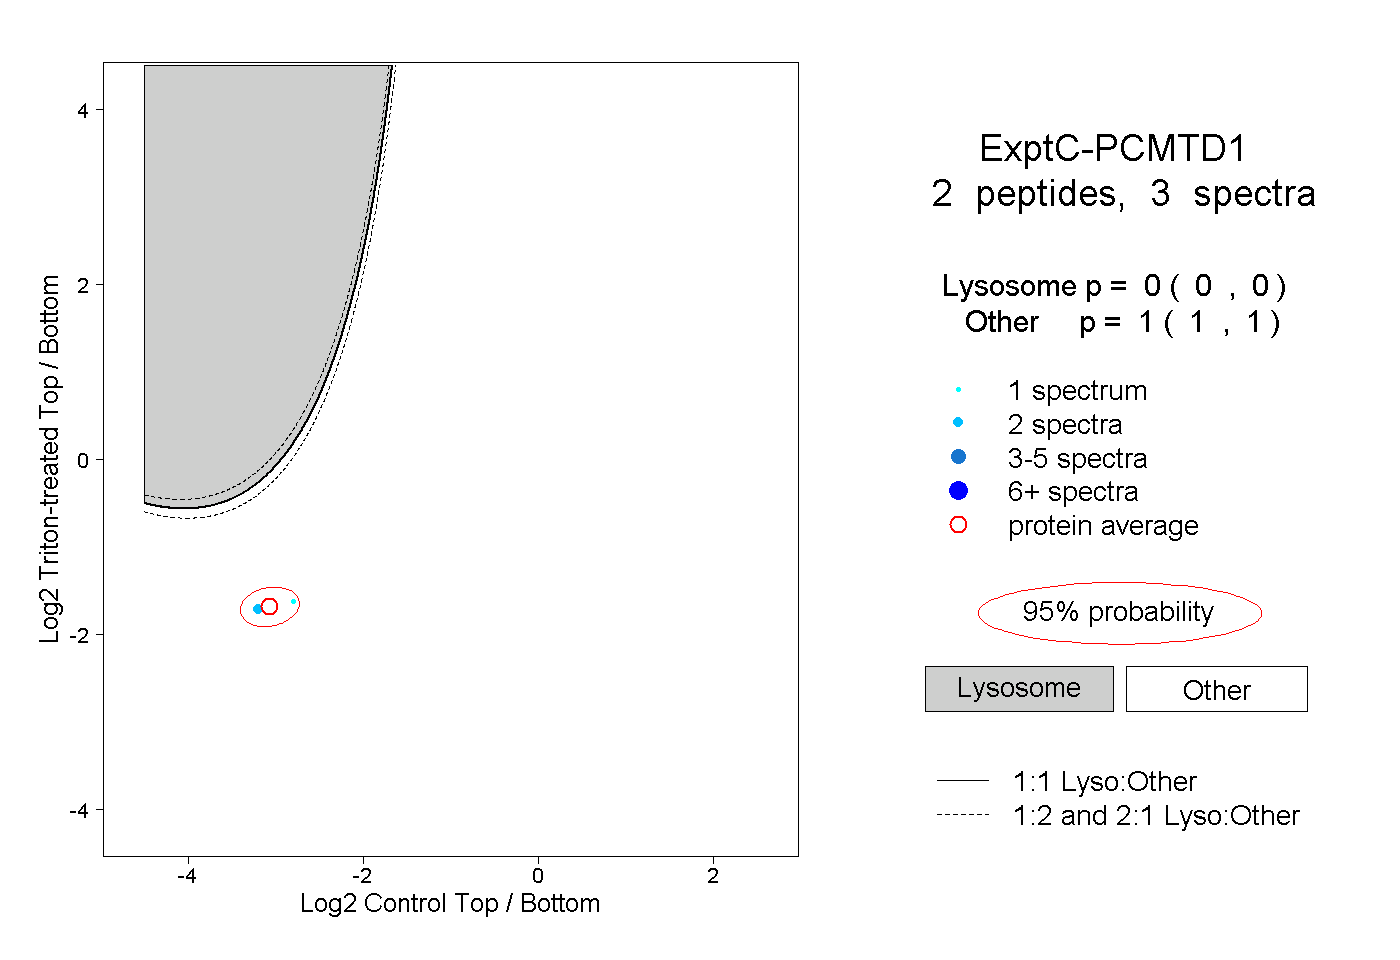 |
0.000 0.000 | 0.000 |
1.000 1.000 | 1.000 |