 4
4peptides
spectra
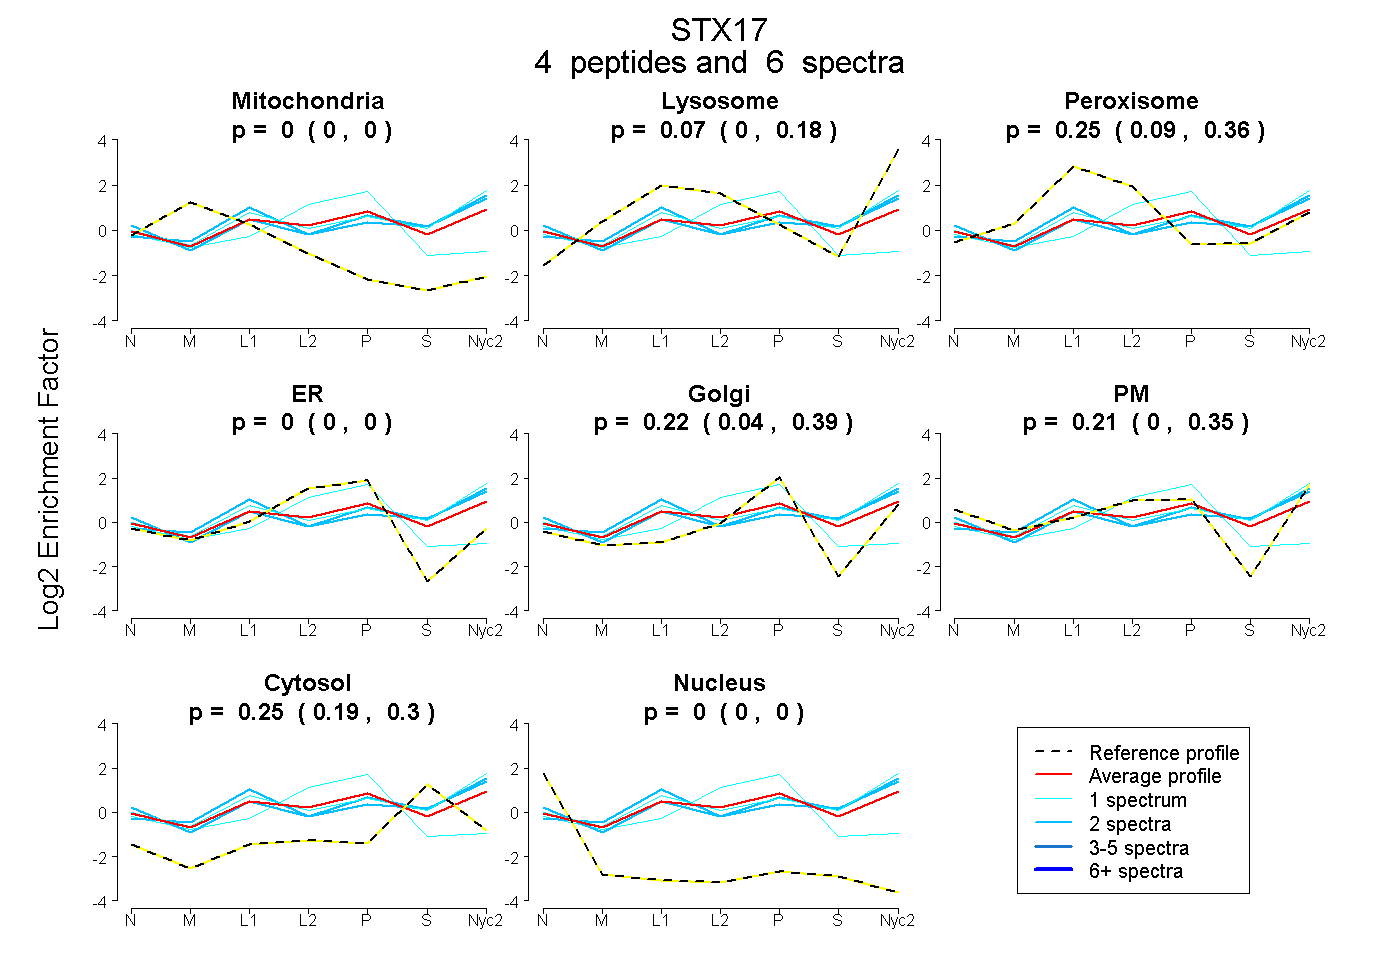
0.000 | 0.000
0.000 | 0.179
0.086 | 0.364
0.000 | 0.000
0.036 | 0.387
0.000 | 0.353
0.191 | 0.295
0.000 | 0.000
3peptides
spectra
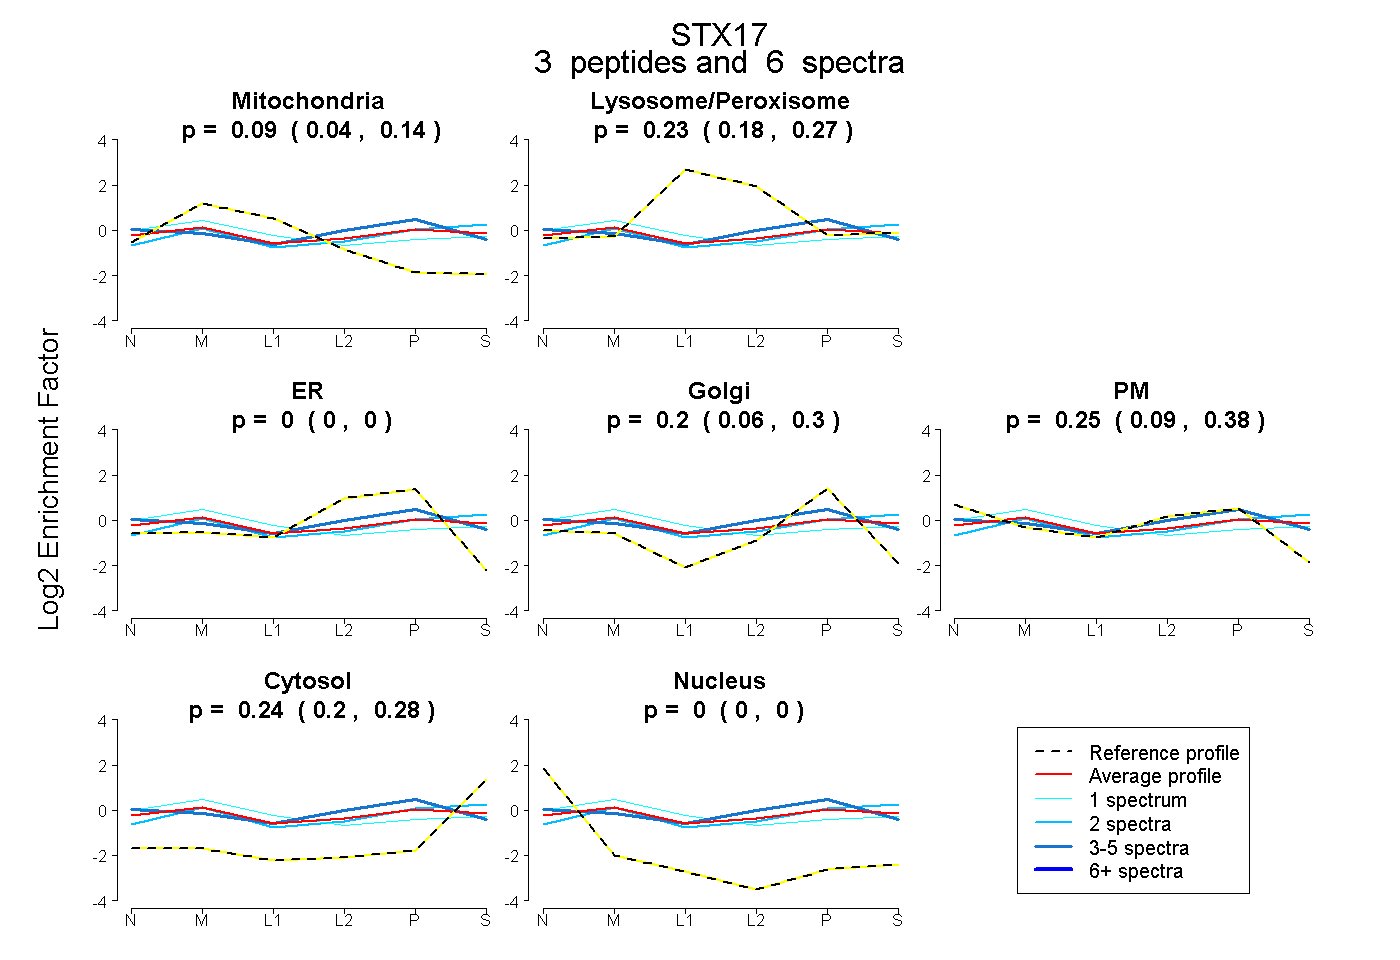
0.038 | 0.135
0.180 | 0.268
0.000 | 0.000
0.061 | 0.301
0.087 | 0.376
0.199 | 0.277
0.000 | 0.000
5peptides
spectra
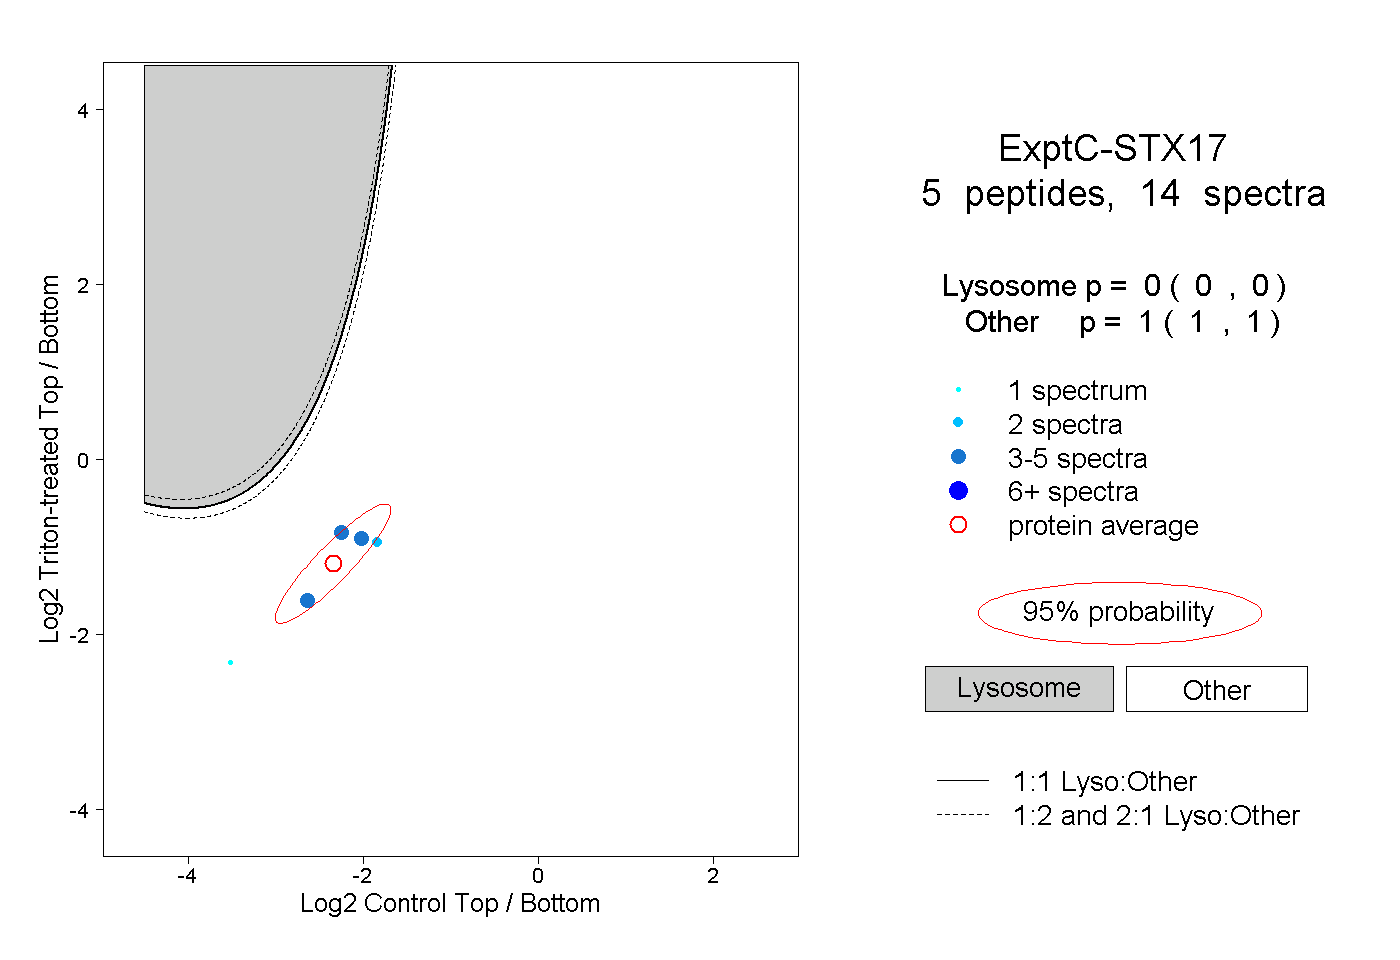
0.000 | 0.000
1.000 | 1.000
2peptides
spectra
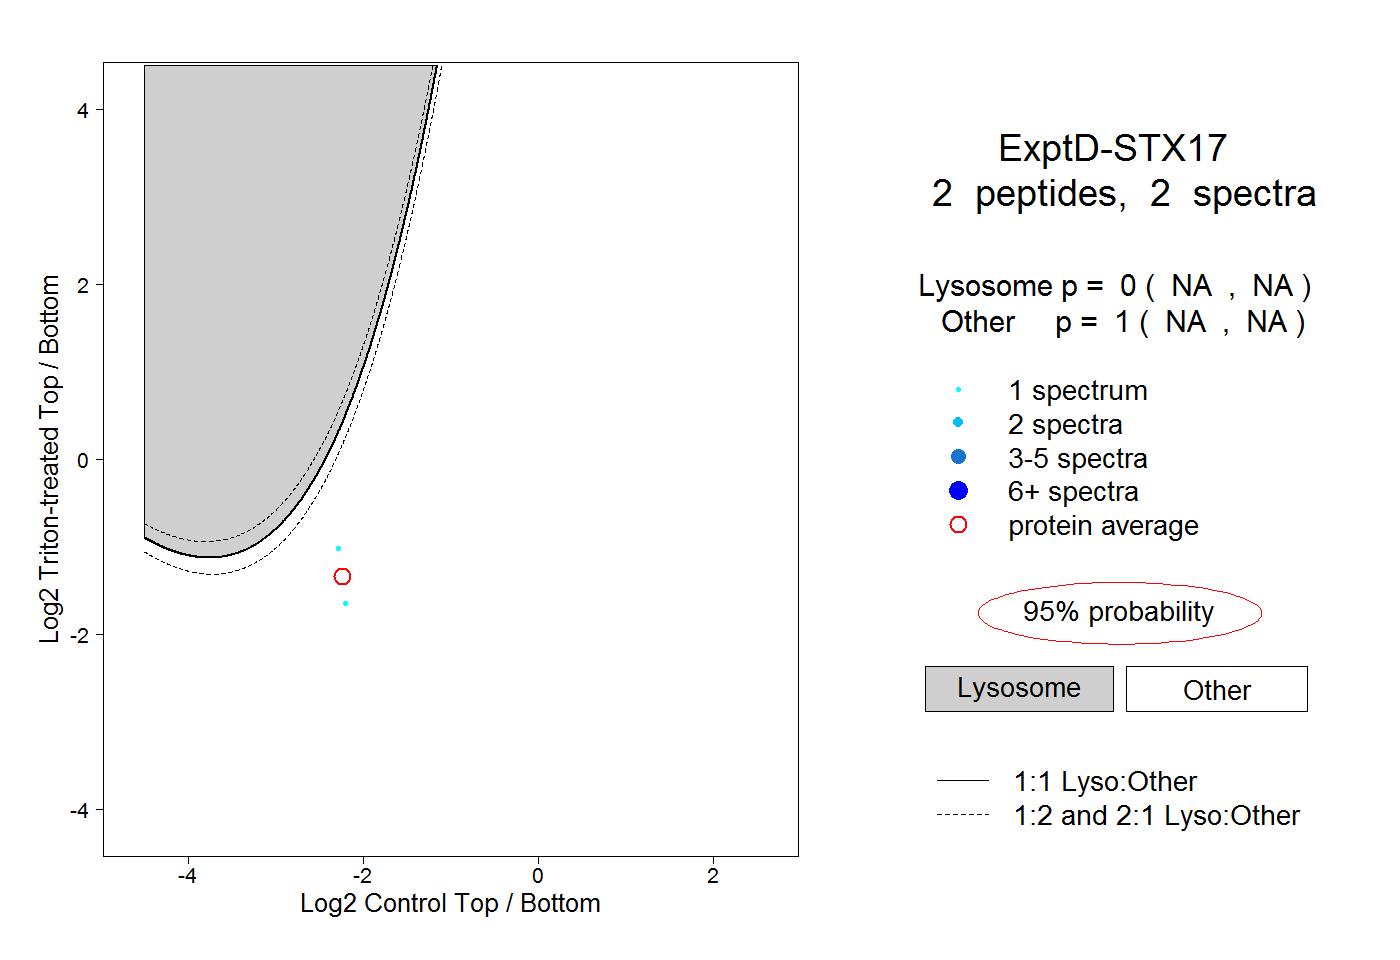
NA | NA
NA | NA