 4
4peptides
spectra
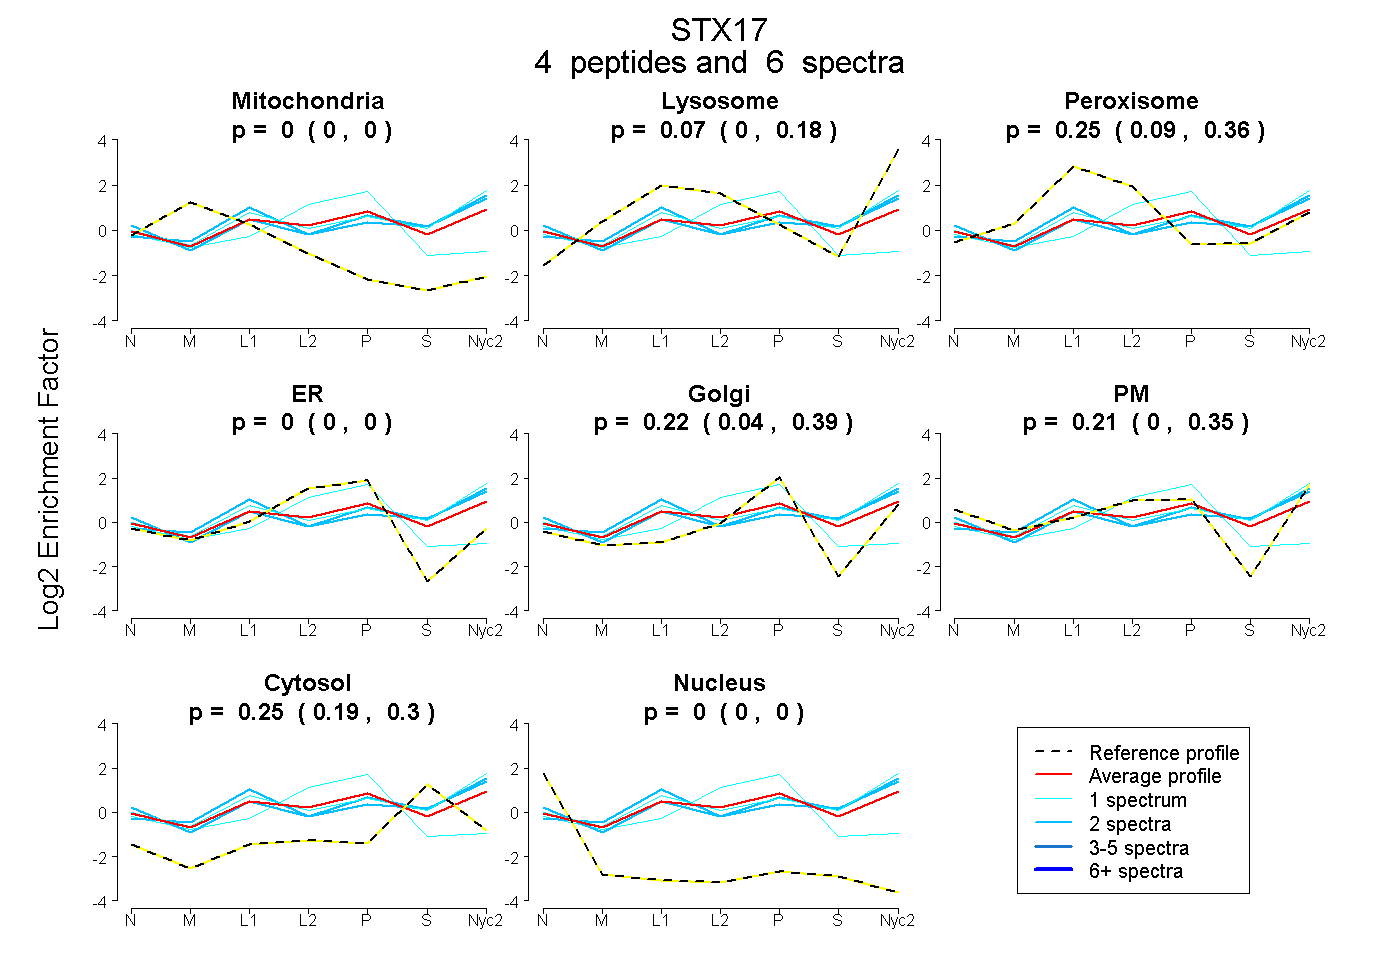
0.000 | 0.000
0.000 | 0.179
0.086 | 0.364
0.000 | 0.000
0.036 | 0.387
0.000 | 0.353
0.191 | 0.295
0.000 | 0.000
| Plot | Mito | Lyso | Perox | ER | Golgi | PM | Cytosol | Nucleus | |||||
| Expt A |
4 peptides |
6 spectra |
|
0.000 0.000 | 0.000 |
0.069 0.000 | 0.179 |
0.251 0.086 | 0.364 |
0.000 0.000 | 0.000 |
0.225 0.036 | 0.387 |
0.208 0.000 | 0.353 |
0.246 0.191 | 0.295 |
0.000 0.000 | 0.000 |
| 2 spectra, IVIPTDLER | 0.000 | 0.317 | 0.162 | 0.000 | 0.125 | 0.115 | 0.281 | 0.000 | ||
| 2 spectra, LHEEHINAGR | 0.000 | 0.173 | 0.089 | 0.000 | 0.000 | 0.376 | 0.362 | 0.000 | ||
| 1 spectrum, NEEALLQPSLTR | 0.000 | 0.301 | 0.076 | 0.000 | 0.000 | 0.331 | 0.293 | 0.000 | ||
| 1 spectrum, HQINIEK | 0.000 | 0.000 | 0.000 | 0.790 | 0.000 | 0.000 | 0.210 | 0.000 |
| Plot | Mito | Lyso or Perox | ER | Golgi | PM | Cytosol | Nucleus | ||||||
| Expt B |
3 peptides |
6 spectra |
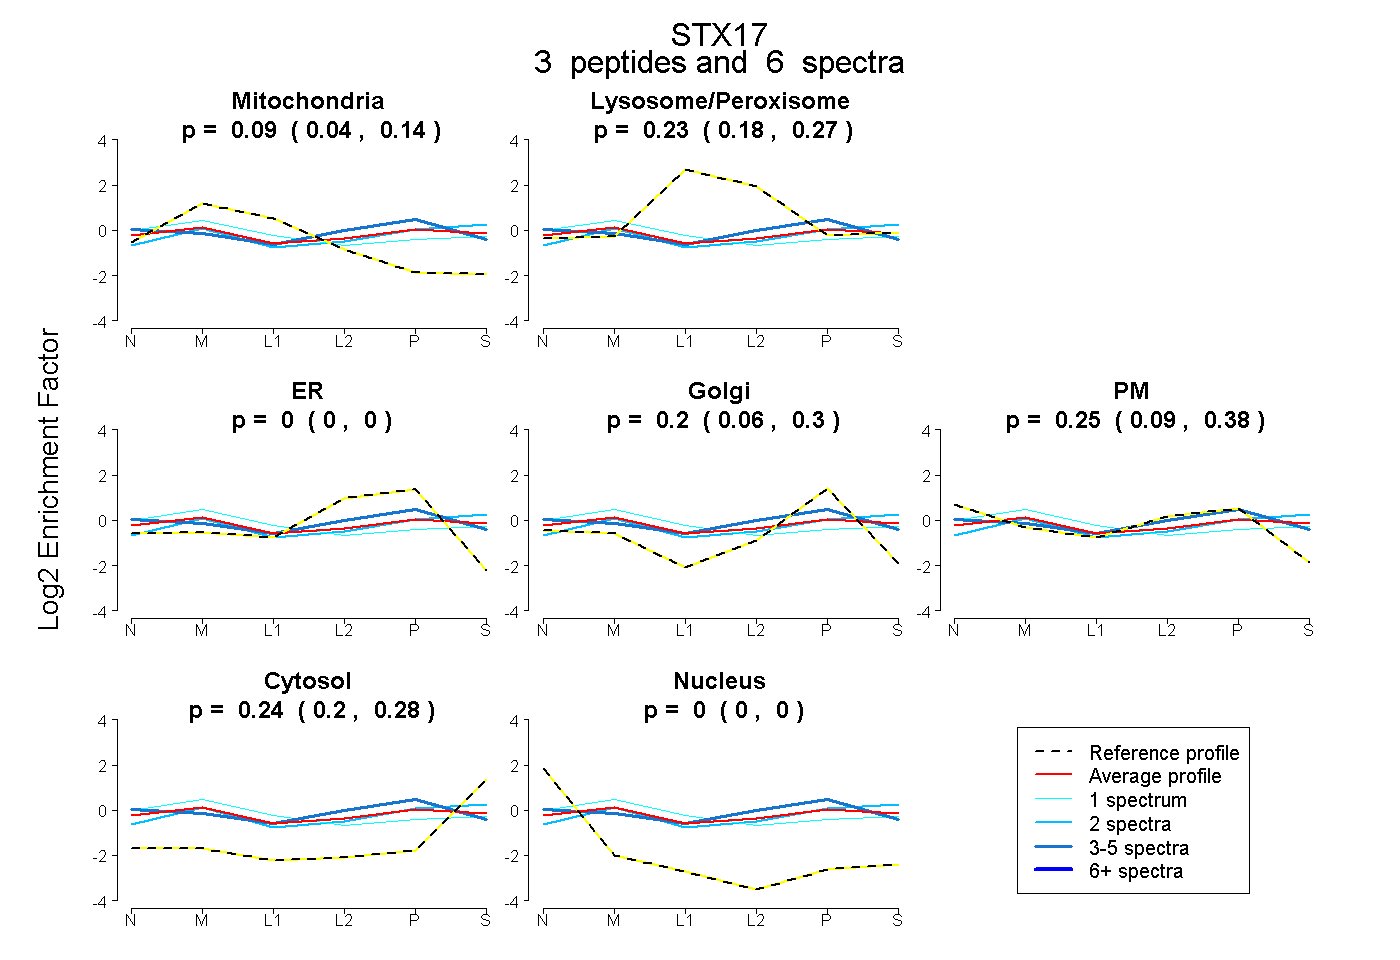 |
0.090 0.038 | 0.135 |
0.228 0.180 | 0.268 |
0.000 0.000 | 0.000 |
0.195 0.061 | 0.301 |
0.246 0.087 | 0.376 |
0.240 0.199 | 0.277 |
0.000 0.000 | 0.000 |
|||
| Plot | Lyso | Other | |||||||||||
| Expt C |
5 peptides |
14 spectra |
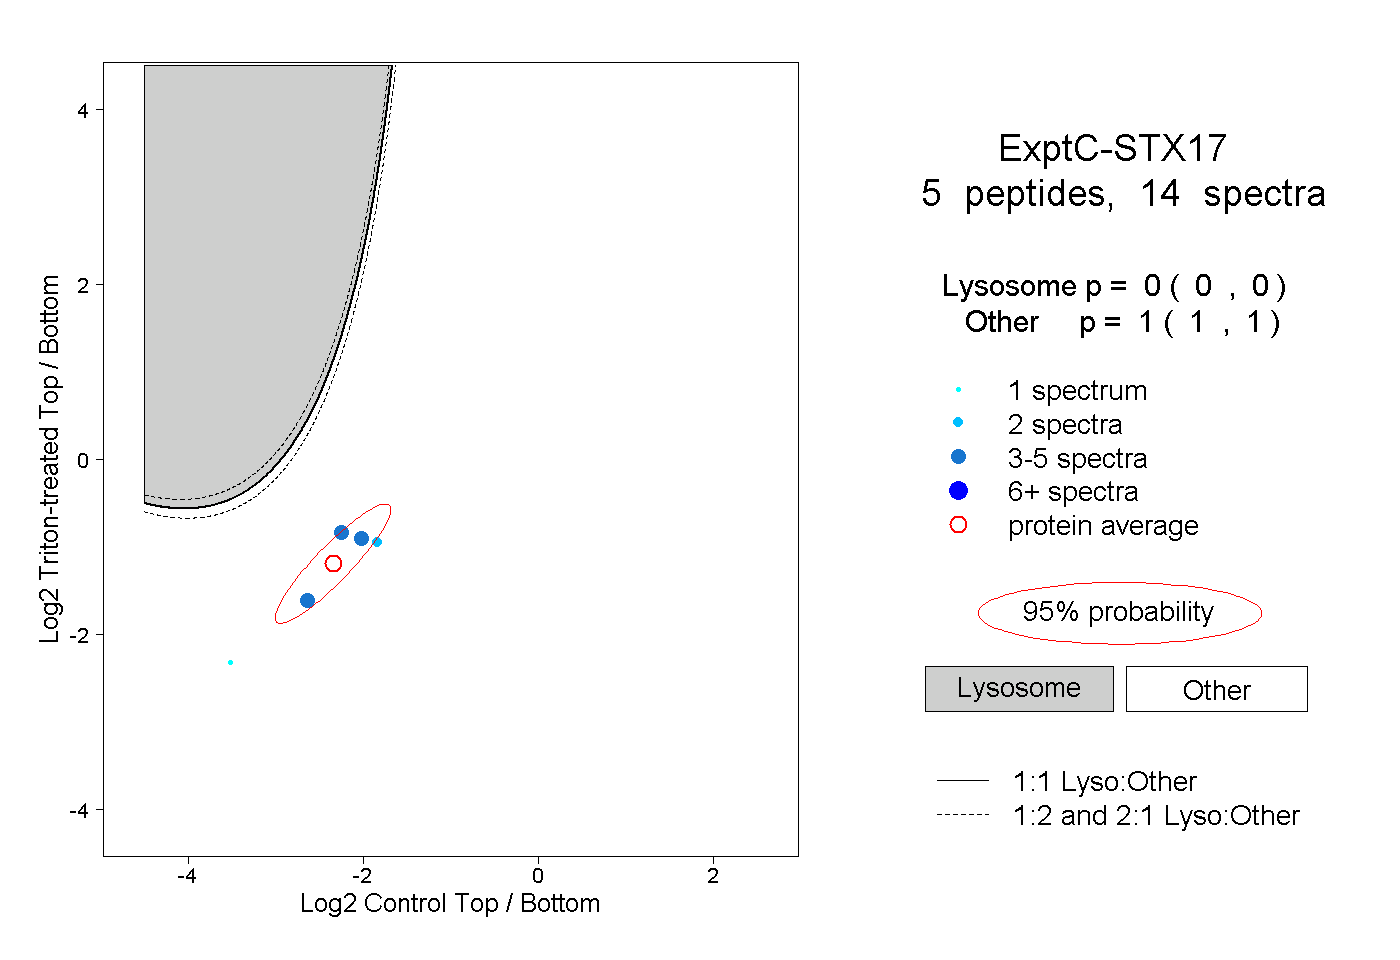 |
0.000 0.000 | 0.000 |
1.000 1.000 | 1.000 |
||||||||
| Plot | Lyso | Other | |||||||||||
| Expt D |
2 peptides |
2 spectra |
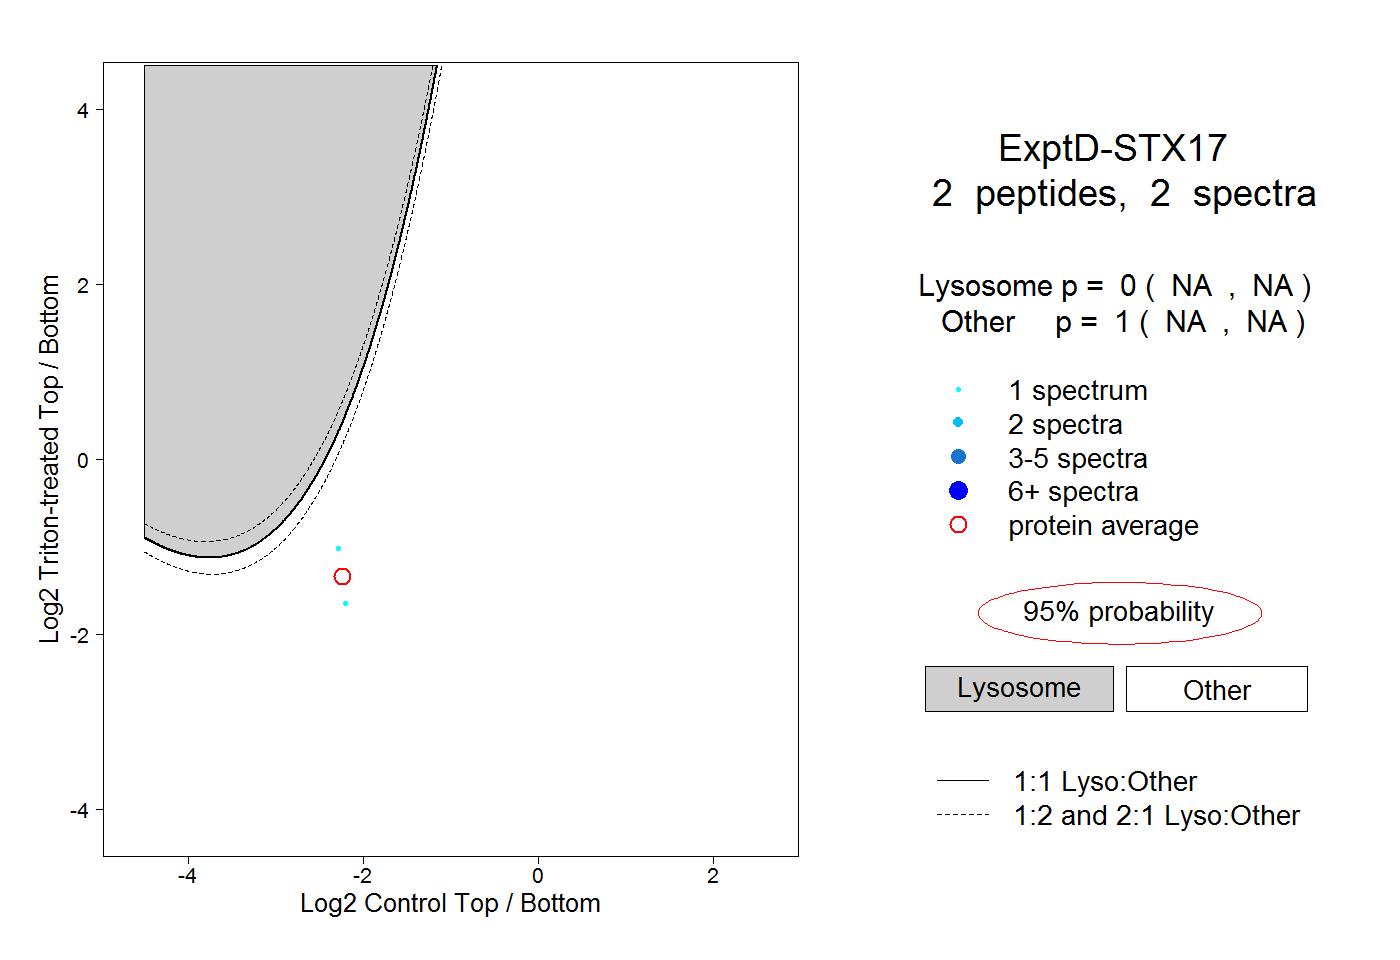 |
0.000 NA | NA |
1.000 NA | NA |