 2
2peptides
spectra
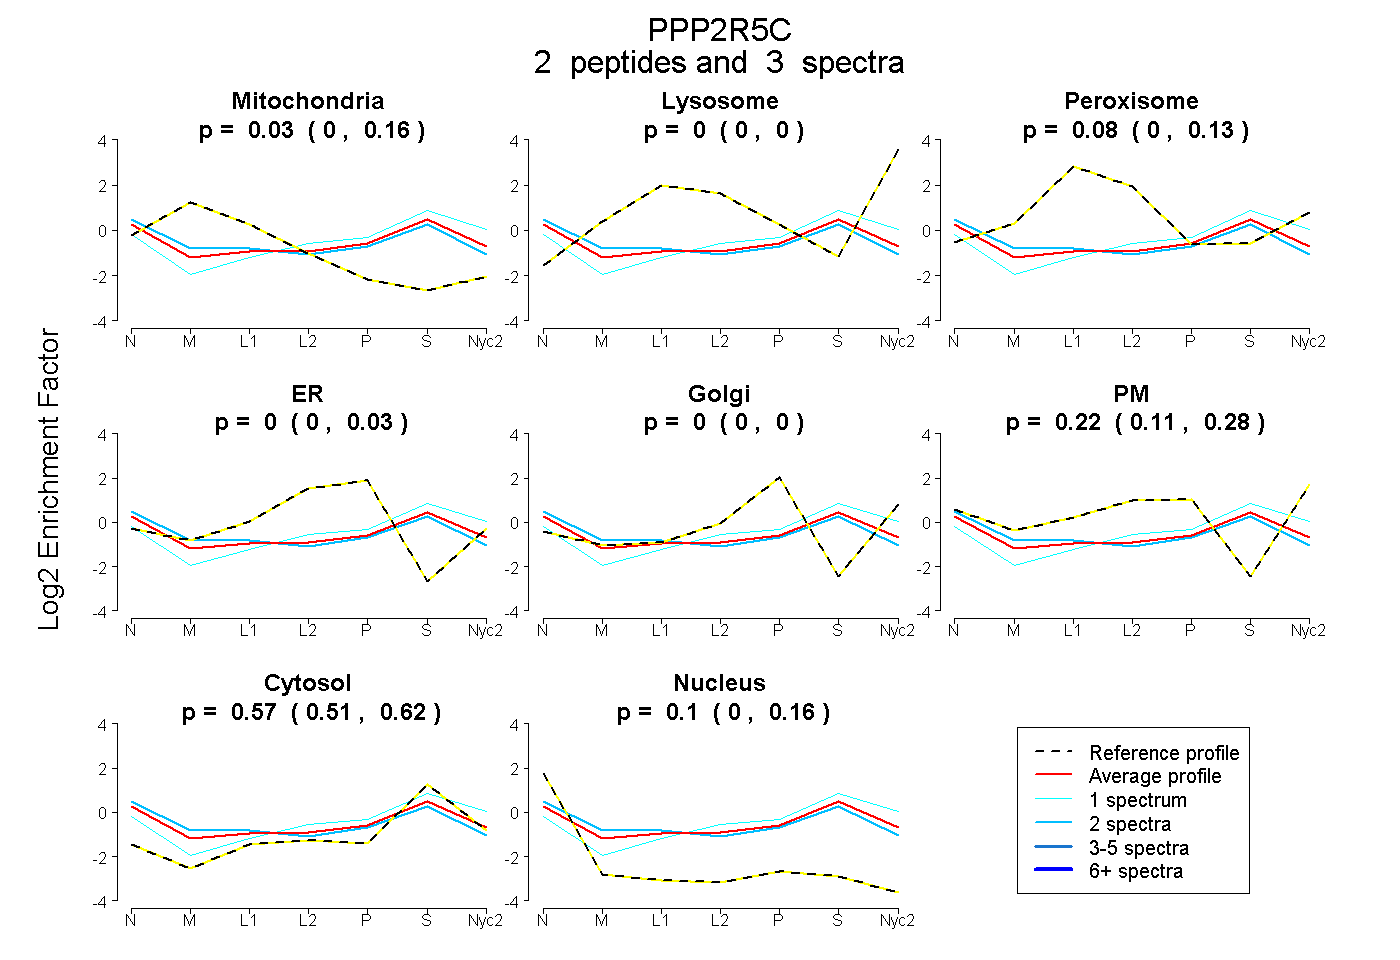
0.000 | 0.157
0.000 | 0.000
0.000 | 0.133
0.000 | 0.033
0.000 | 0.000
0.111 | 0.285
0.511 | 0.619
0.003 | 0.158
1peptide
spectra
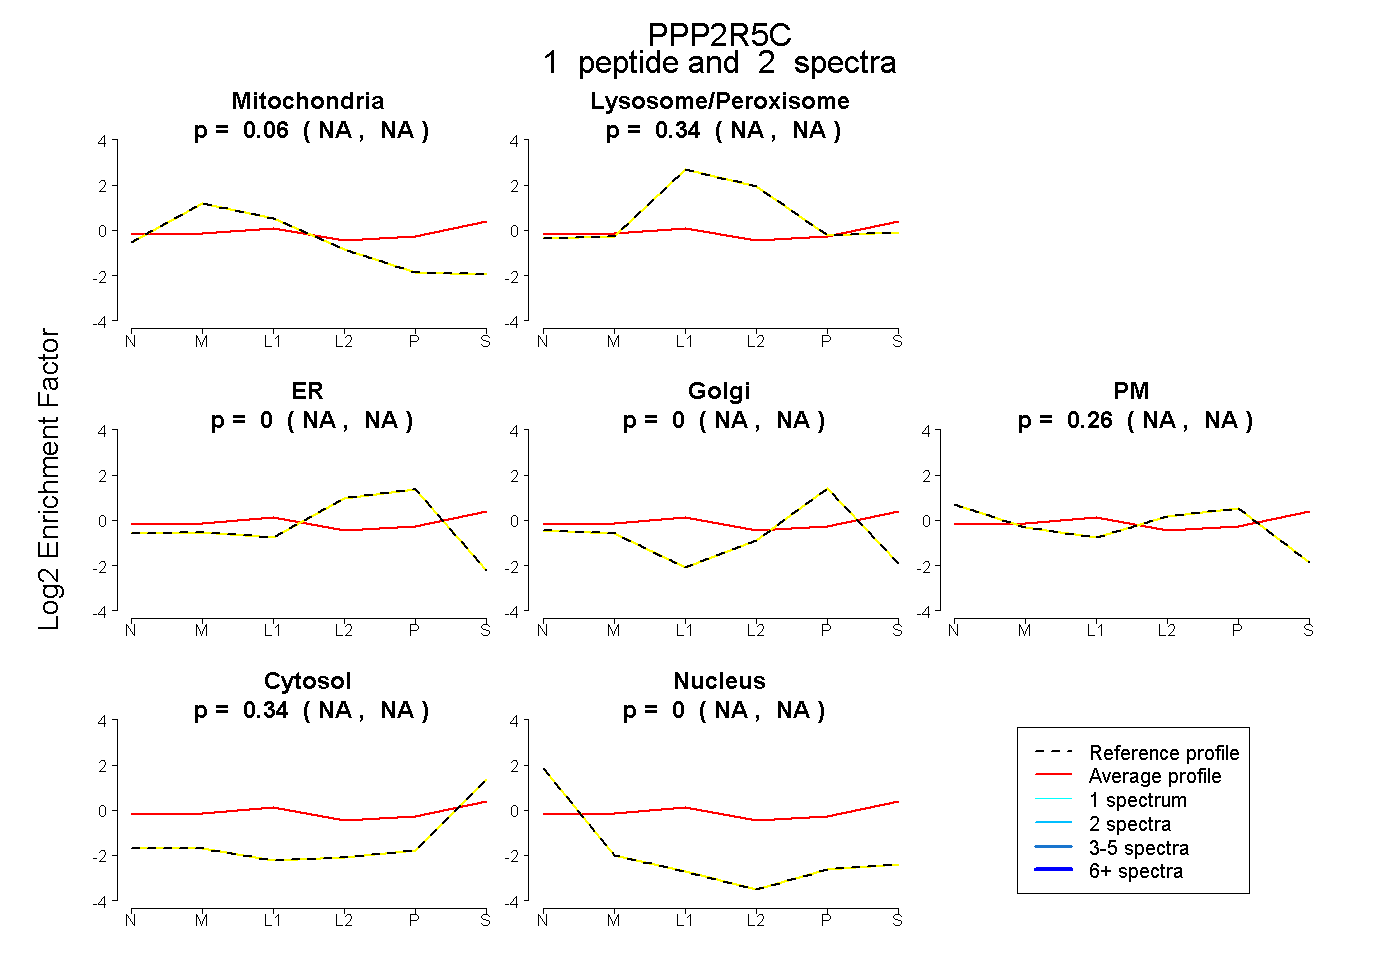
NA | NA
NA | NA
NA | NA
NA | NA
NA | NA
NA | NA
NA | NA
1peptide
spectrum
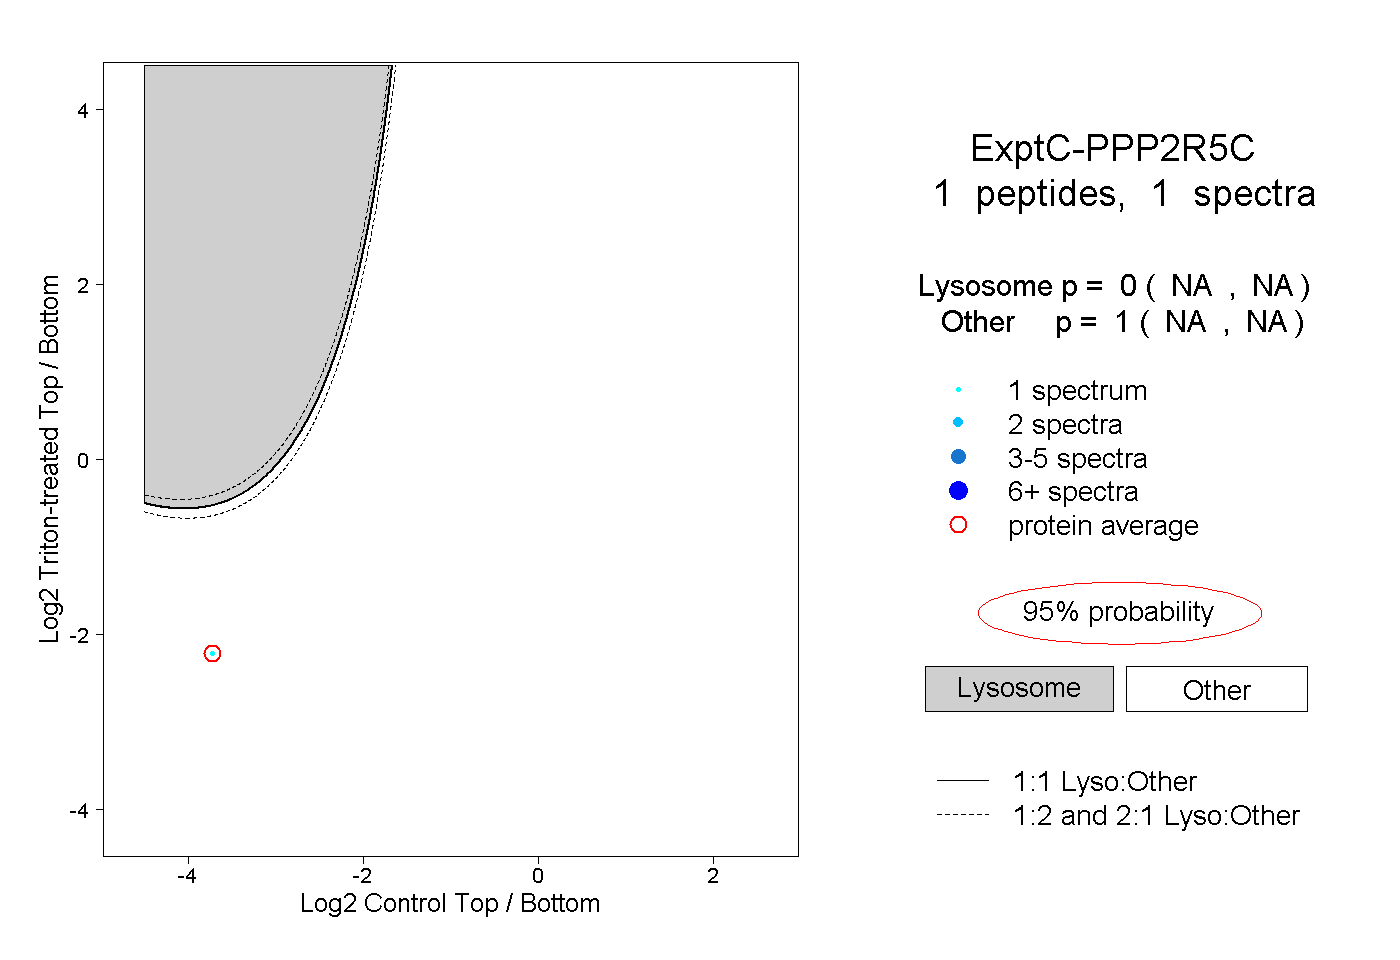
NA | NA
NA | NA