 2
2peptides
spectra
0.000 | 0.157
0.000 | 0.000
0.000 | 0.133
0.000 | 0.033
0.000 | 0.000
0.111 | 0.285
0.511 | 0.619
0.003 | 0.158
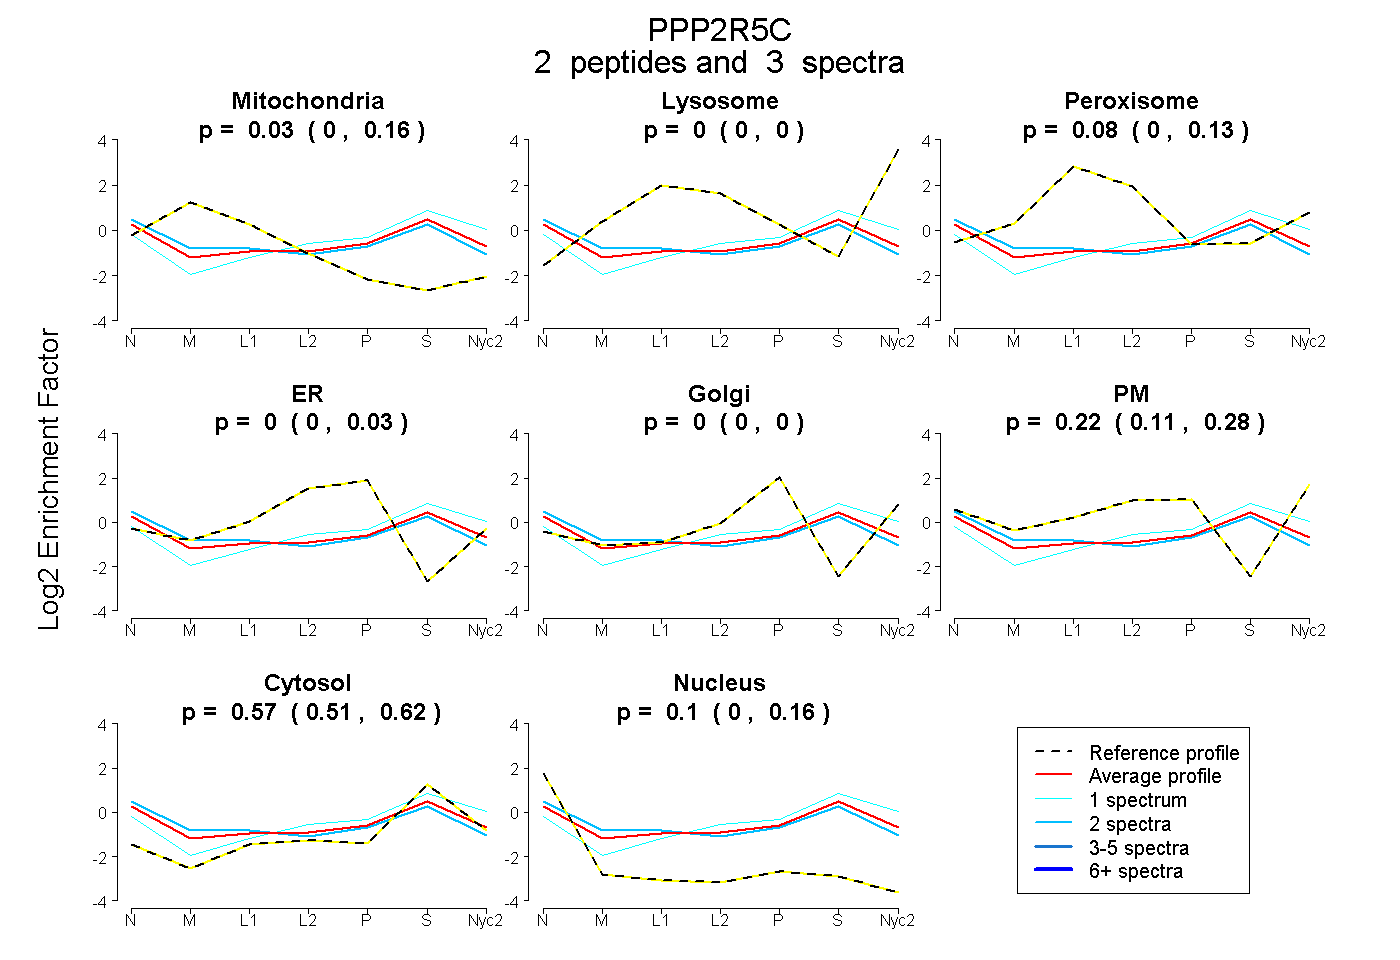
| Plot | Mito | Lyso | Perox | ER | Golgi | PM | Cytosol | Nucleus | |||||
| Expt A |
2 peptides |
3 spectra |
|
0.035 0.000 | 0.157 |
0.000 0.000 | 0.000 |
0.077 0.000 | 0.133 |
0.000 0.000 | 0.033 |
0.000 0.000 | 0.000 |
0.217 0.111 | 0.285 |
0.567 0.511 | 0.619 |
0.104 0.003 | 0.158 |
| 2 spectra, SELPQDPHTEK | 0.138 | 0.000 | 0.090 | 0.000 | 0.000 | 0.162 | 0.484 | 0.127 | ||
| 1 spectrum, IMEPLFR | 0.000 | 0.000 | 0.000 | 0.000 | 0.000 | 0.281 | 0.719 | 0.000 |
| Plot | Mito | Lyso or Perox | ER | Golgi | PM | Cytosol | Nucleus | ||||||
| Expt B |
1 peptide |
2 spectra |
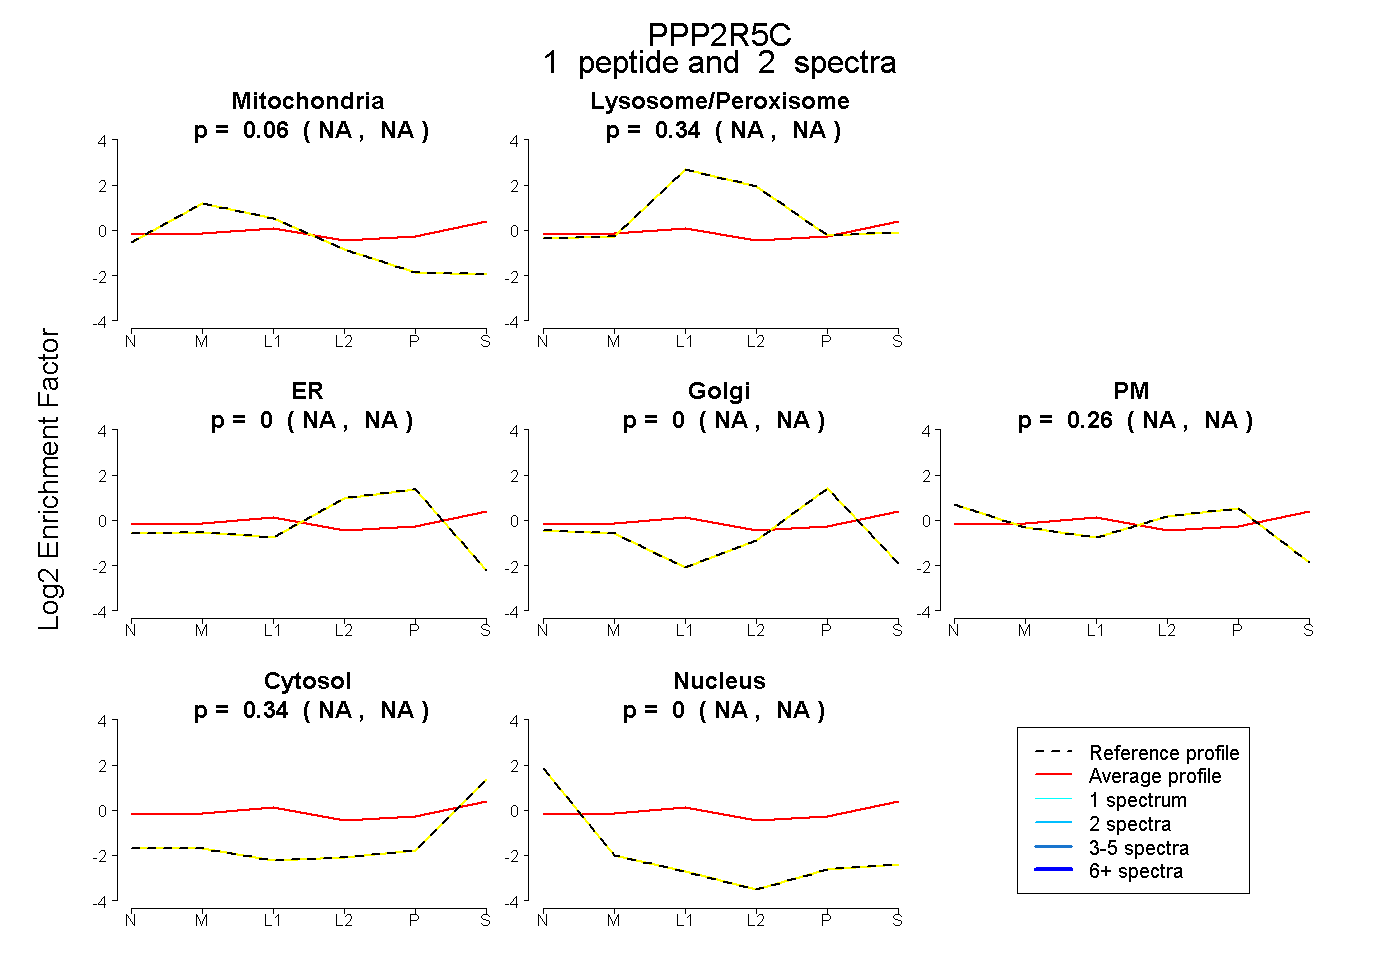 |
0.056 NA | NA |
0.342 NA | NA |
0.000 NA | NA |
0.000 NA | NA |
0.261 NA | NA |
0.341 NA | NA |
0.000 NA | NA |
|||
| Plot | Lyso | Other | |||||||||||
| Expt C |
1 peptide |
1 spectrum |
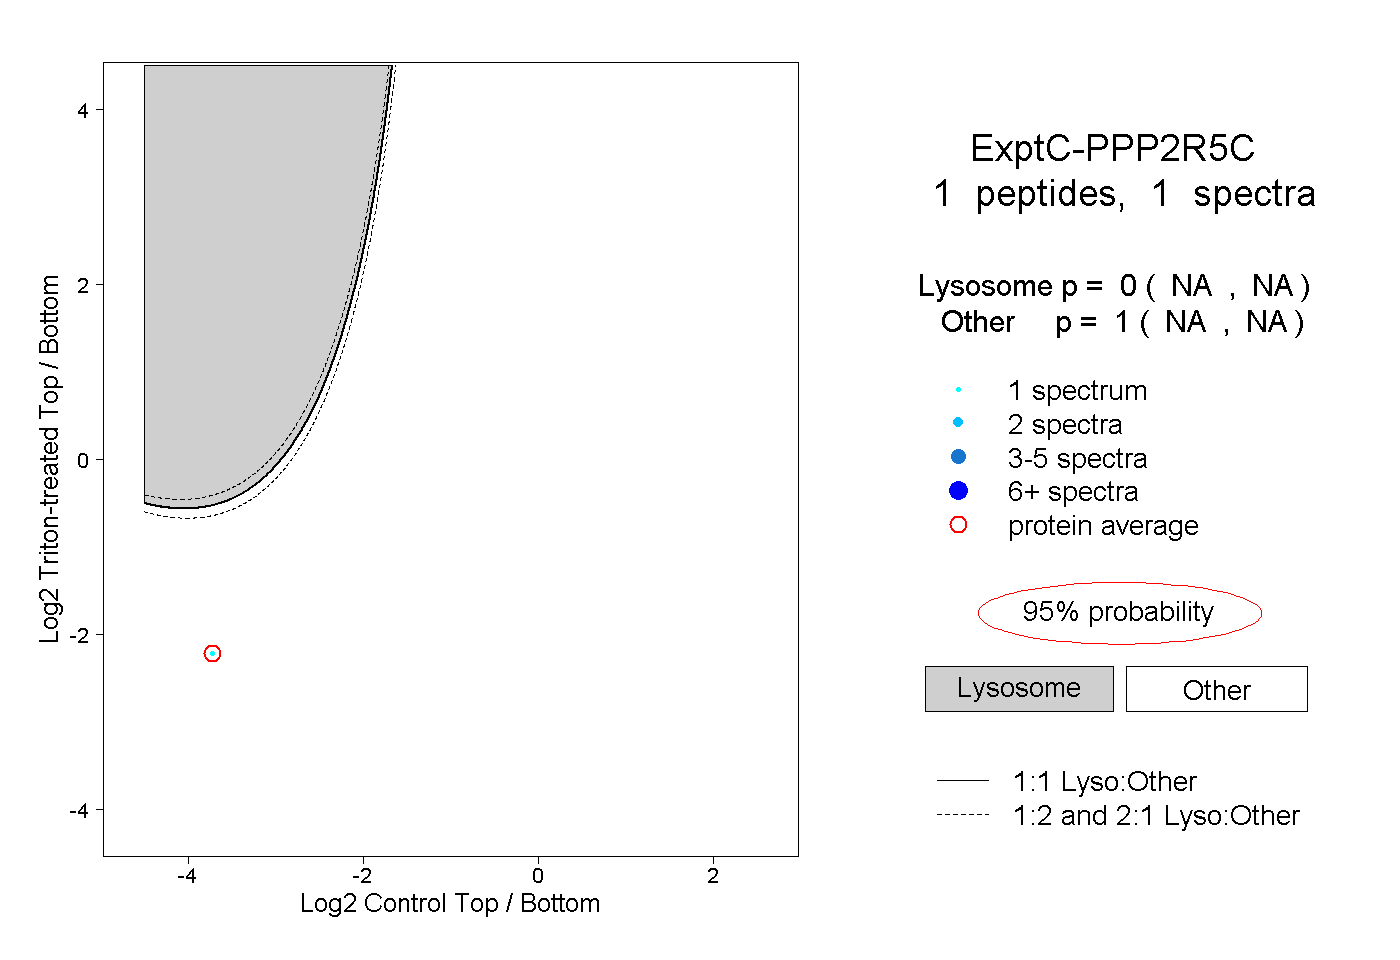 |
0.000 NA | NA |
1.000 NA | NA |