 7
7peptides
spectra
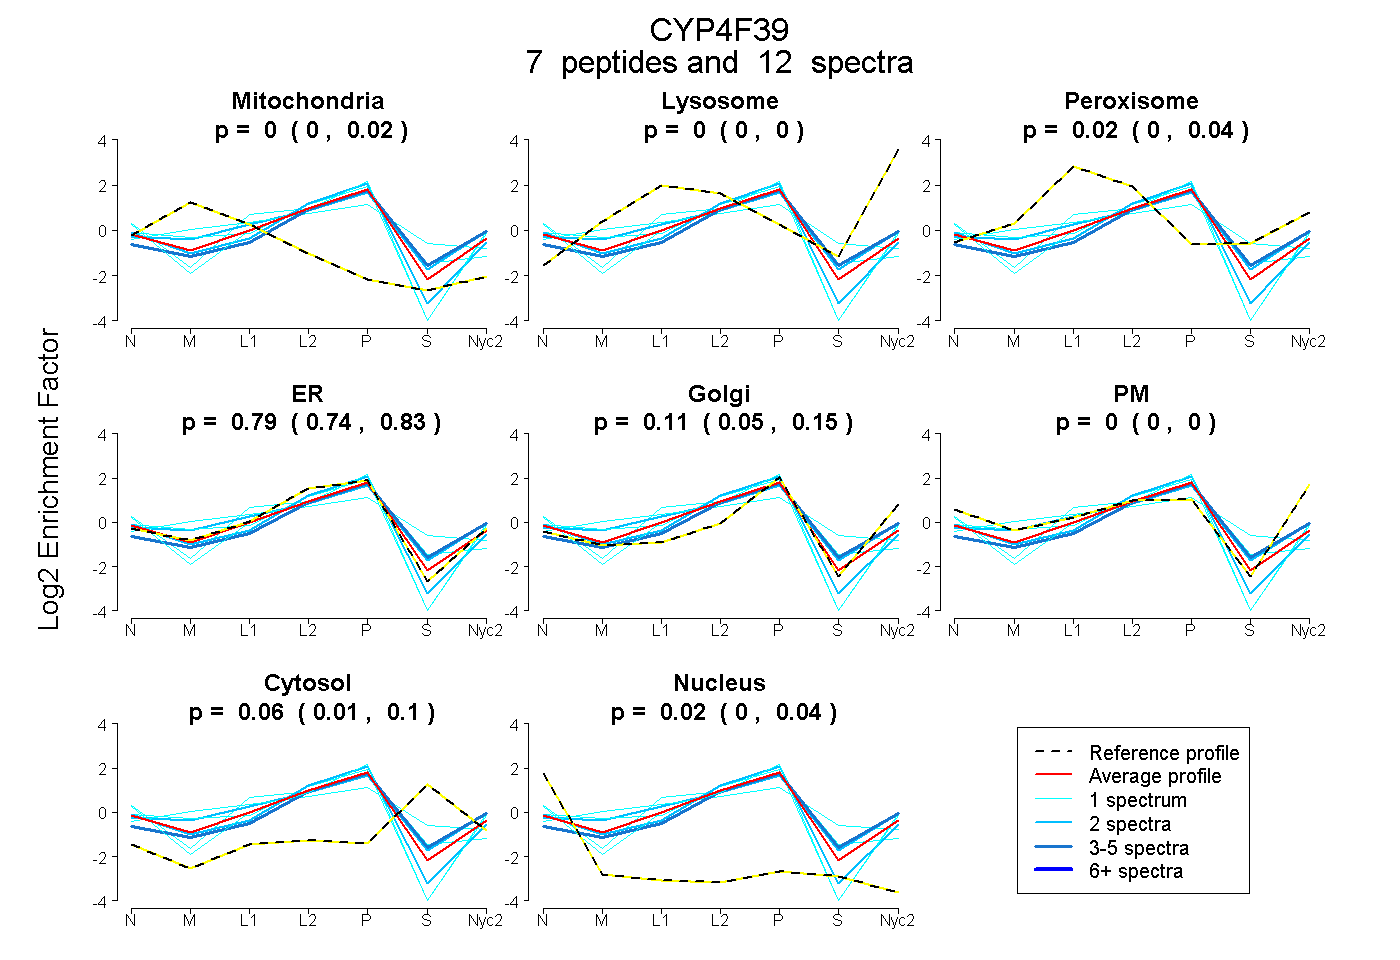
0.000 | 0.024
0.000 | 0.000
0.000 | 0.042
0.743 | 0.833
0.053 | 0.148
0.000 | 0.000
0.010 | 0.099
0.000 | 0.039
1peptide
spectrum
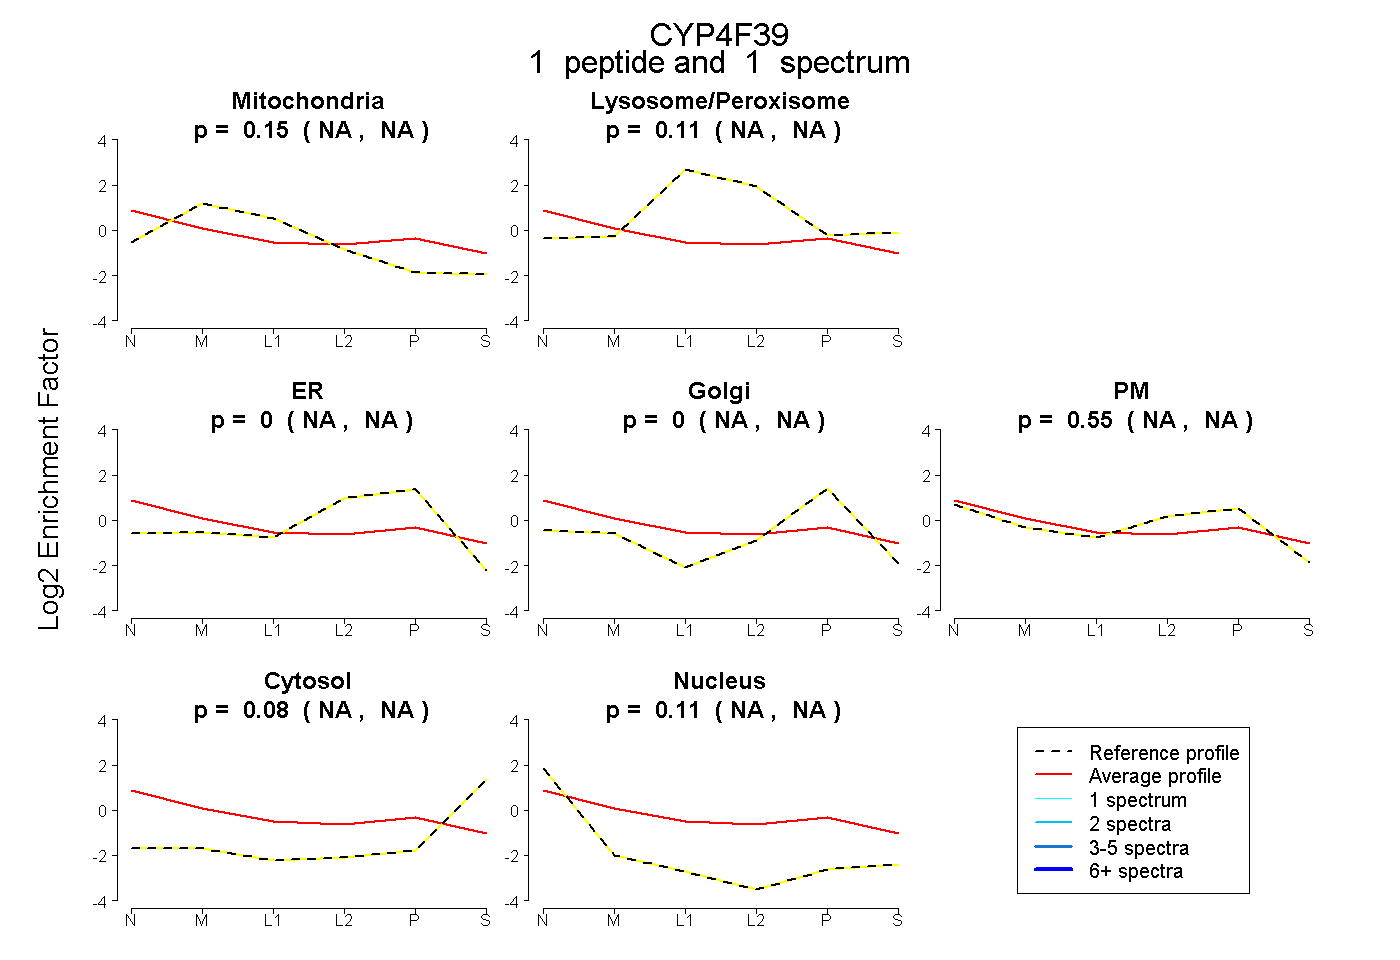
NA | NA
NA | NA
NA | NA
NA | NA
NA | NA
NA | NA
NA | NA
4peptides
spectra
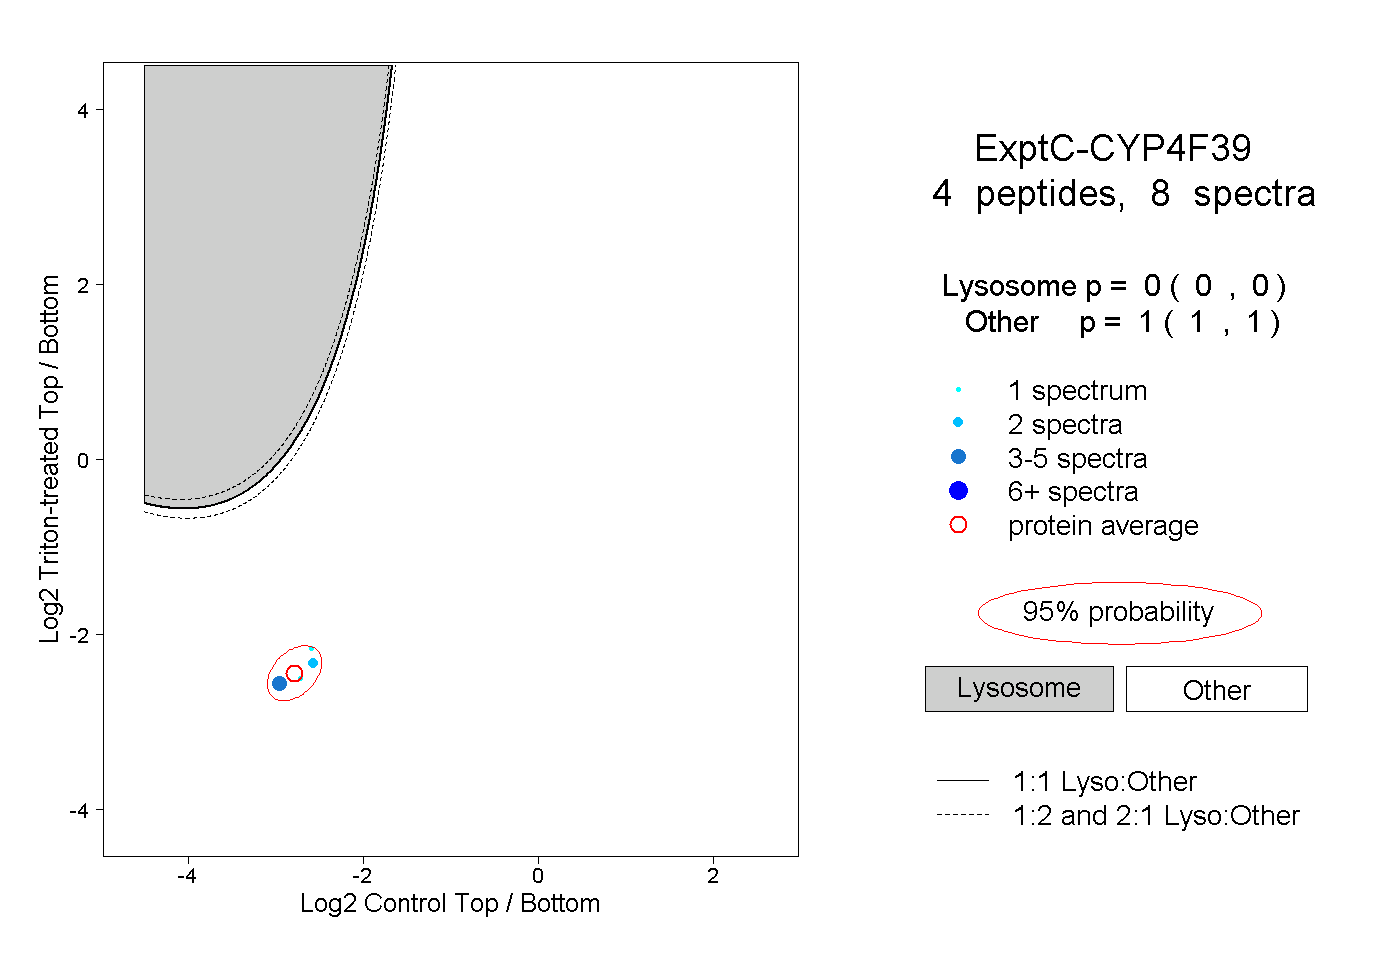
0.000 | 0.000
1.000 | 1.000