 7
7peptides
spectra
0.000 | 0.024
0.000 | 0.000
0.000 | 0.042
0.743 | 0.833
0.053 | 0.148
0.000 | 0.000
0.010 | 0.099
0.000 | 0.039
| Plot | Mito | Lyso | Perox | ER | Golgi | PM | Cytosol | Nucleus | |||||
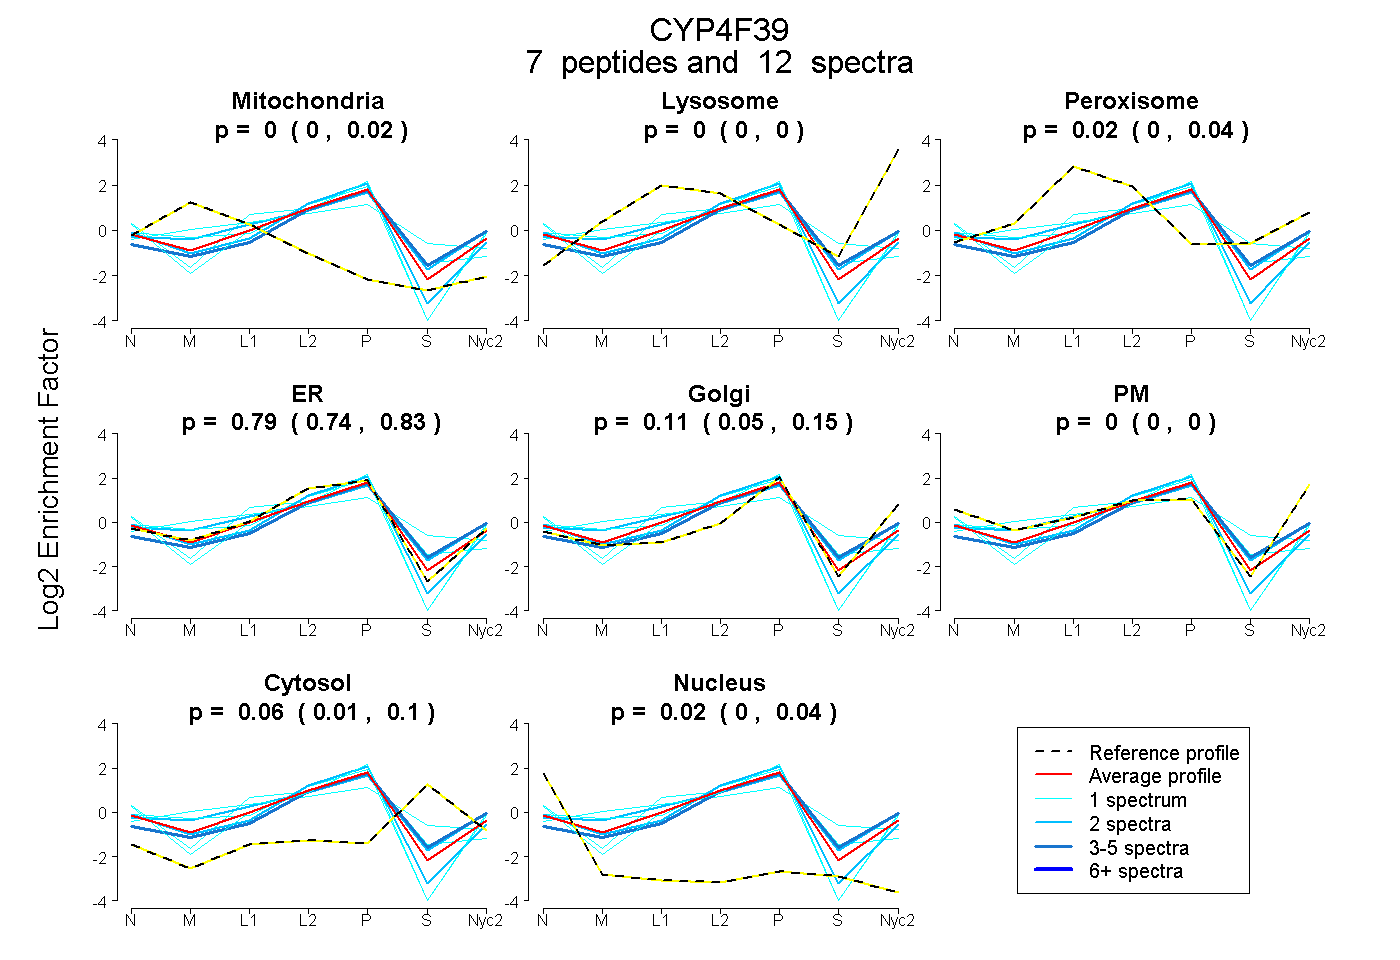
| Expt A |
7 peptides |
12 spectra |
|
0.000 0.000 | 0.024 |
0.000 0.000 | 0.000 |
0.024 0.000 | 0.042 |
0.790 0.743 | 0.833 |
0.107 0.053 | 0.148 |
0.000 0.000 | 0.000 |
0.058 0.010 | 0.099 |
0.021 0.000 | 0.039 |
| 2 spectra, QACDTVHNFTTEVIQQR | 0.000 | 0.000 | 0.000 | 0.893 | 0.056 | 0.000 | 0.000 | 0.050 | ||
| 1 spectrum, GLQNEK | 0.066 | 0.000 | 0.221 | 0.507 | 0.000 | 0.000 | 0.206 | 0.000 | ||
| 1 spectrum, SPLAFVPFSAGPR | 0.000 | 0.000 | 0.000 | 0.776 | 0.166 | 0.000 | 0.000 | 0.058 | ||
| 1 spectrum, FDPDIPQQR | 0.043 | 0.000 | 0.000 | 0.809 | 0.075 | 0.073 | 0.000 | 0.000 | ||
| 1 spectrum, CVFSYSSDCQEK | 0.000 | 0.000 | 0.074 | 0.762 | 0.000 | 0.000 | 0.121 | 0.044 | ||
| 2 spectra, ELGAEAWLK | 0.017 | 0.000 | 0.178 | 0.484 | 0.288 | 0.000 | 0.033 | 0.000 | ||
| 4 spectra, QFPPVTLISR | 0.000 | 0.011 | 0.000 | 0.596 | 0.232 | 0.000 | 0.161 | 0.000 |
| Plot | Mito | Lyso or Perox | ER | Golgi | PM | Cytosol | Nucleus | ||||||
| Expt B |
1 peptide |
1 spectrum |
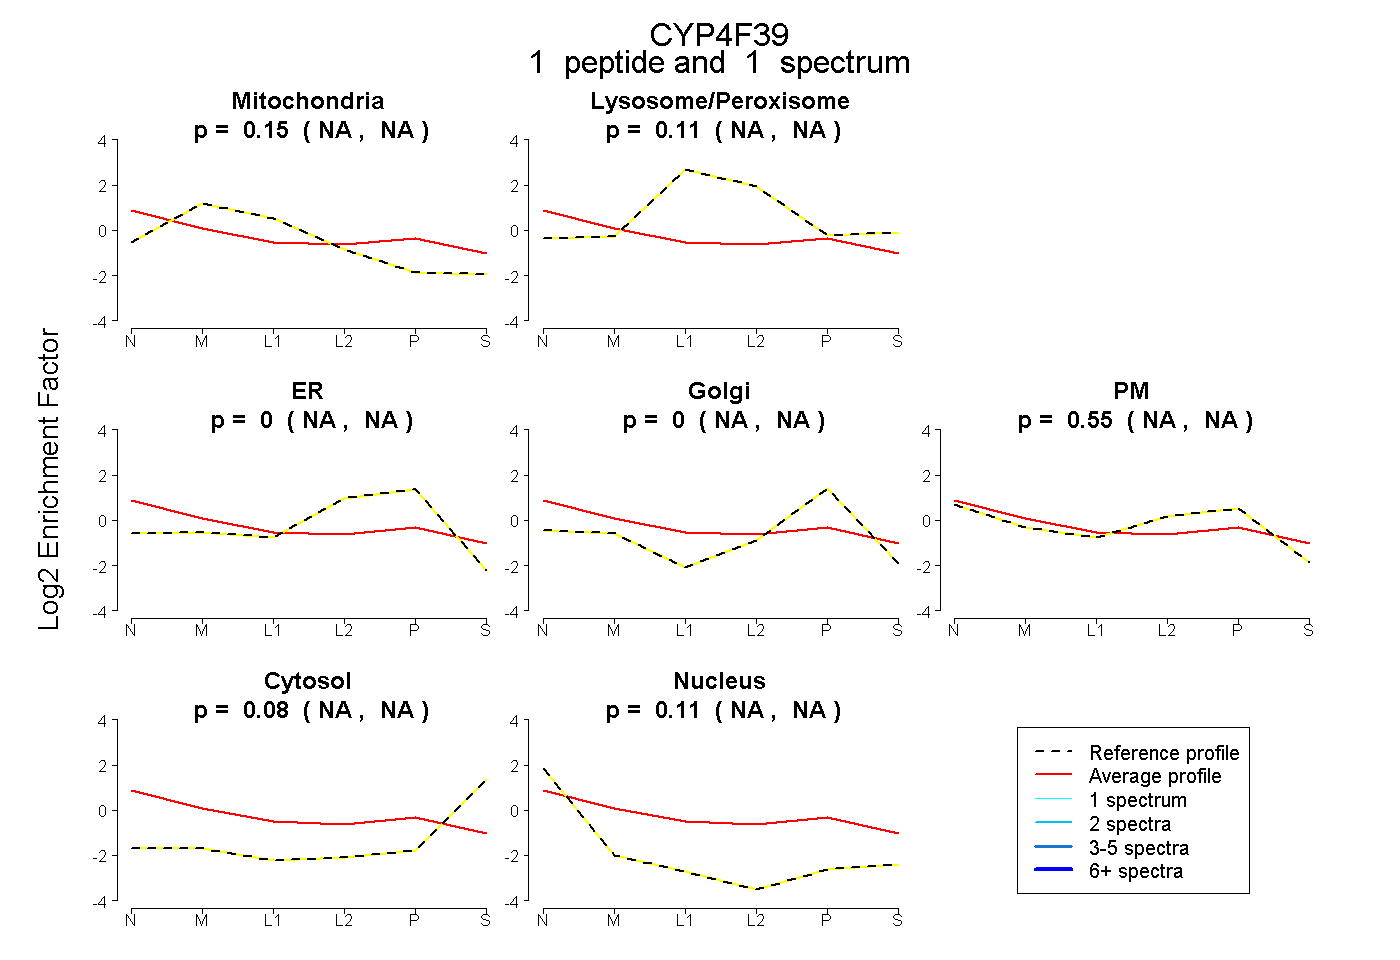 |
0.150 NA | NA |
0.105 NA | NA |
0.000 NA | NA |
0.000 NA | NA |
0.554 NA | NA |
0.076 NA | NA |
0.114 NA | NA |
|||
| Plot | Lyso | Other | |||||||||||
| Expt C |
4 peptides |
8 spectra |
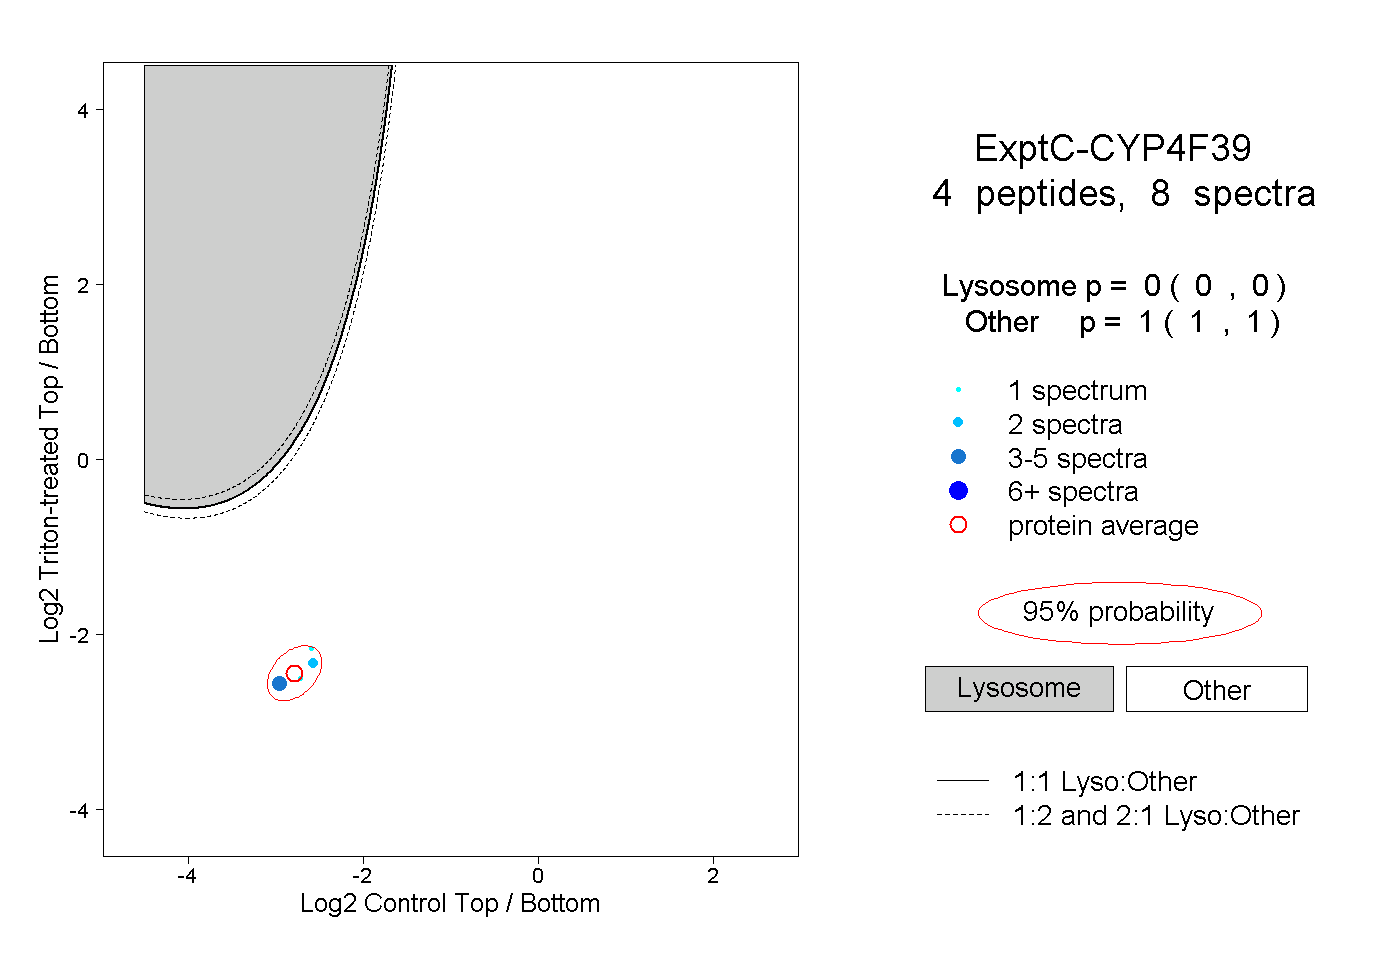 |
0.000 0.000 | 0.000 |
1.000 1.000 | 1.000 |