 10
10peptides
spectra
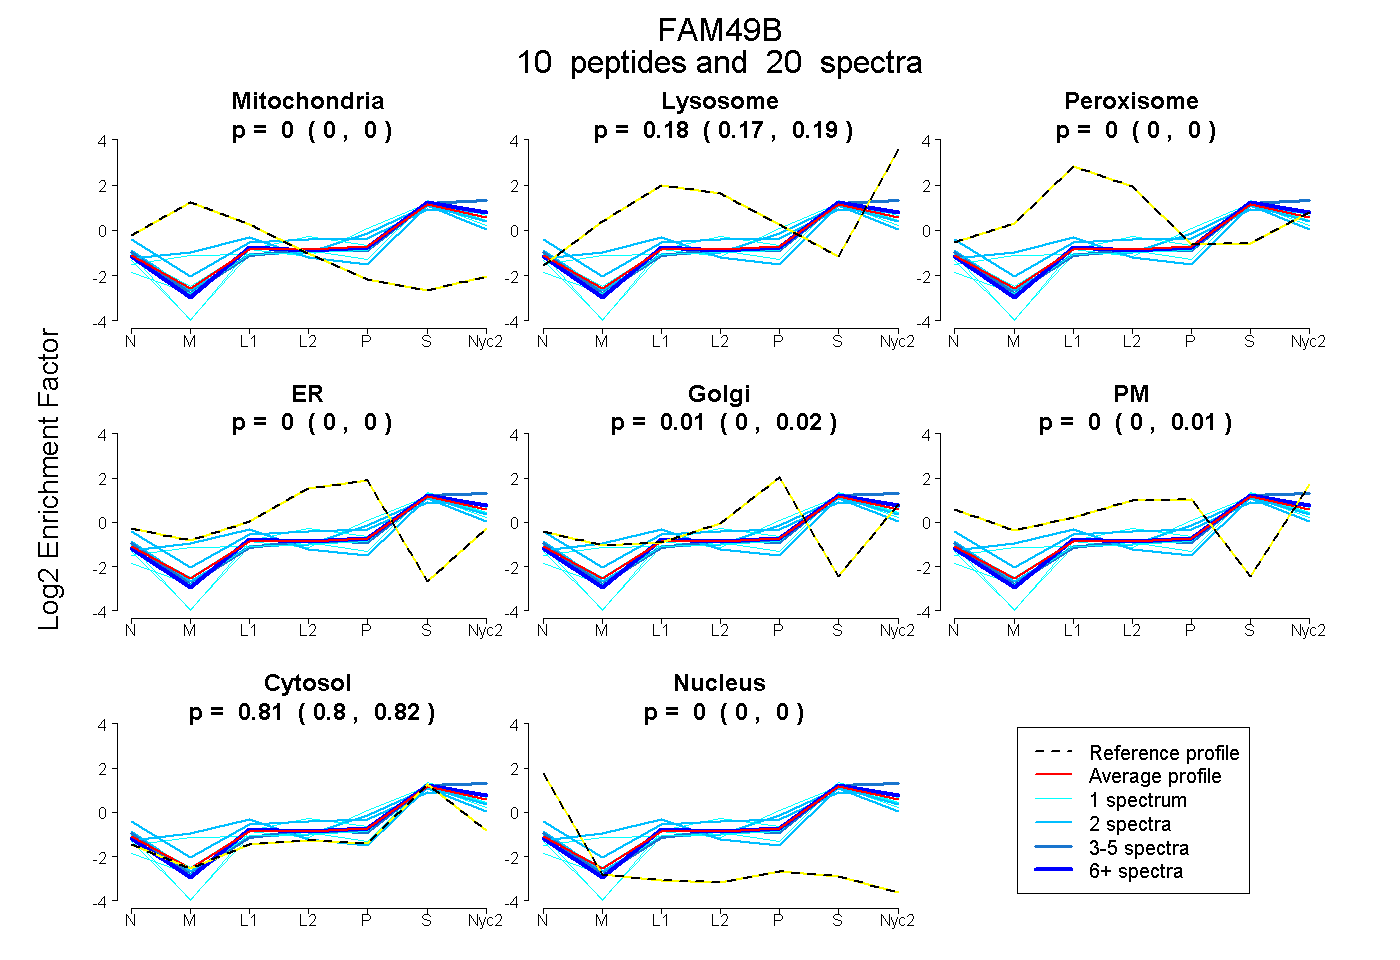
0.000 | 0.000
0.168 | 0.190
0.000 | 0.000
0.000 | 0.000
0.000 | 0.022
0.000 | 0.011
0.798 | 0.816
0.000 | 0.000
1peptide
spectrum
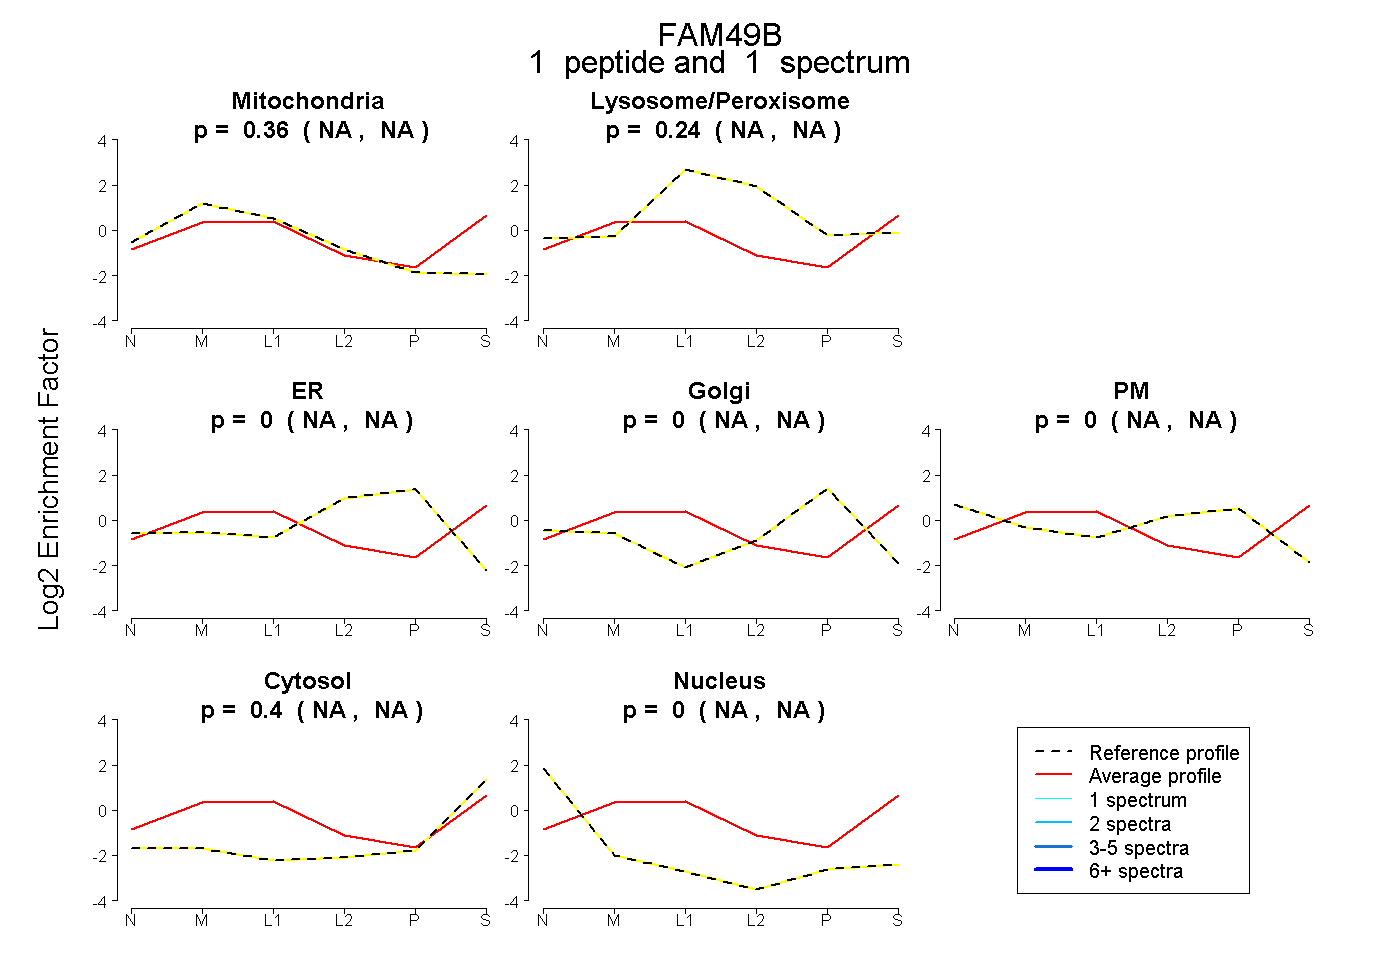
NA | NA
NA | NA
NA | NA
NA | NA
NA | NA
NA | NA
NA | NA
9peptides
spectra
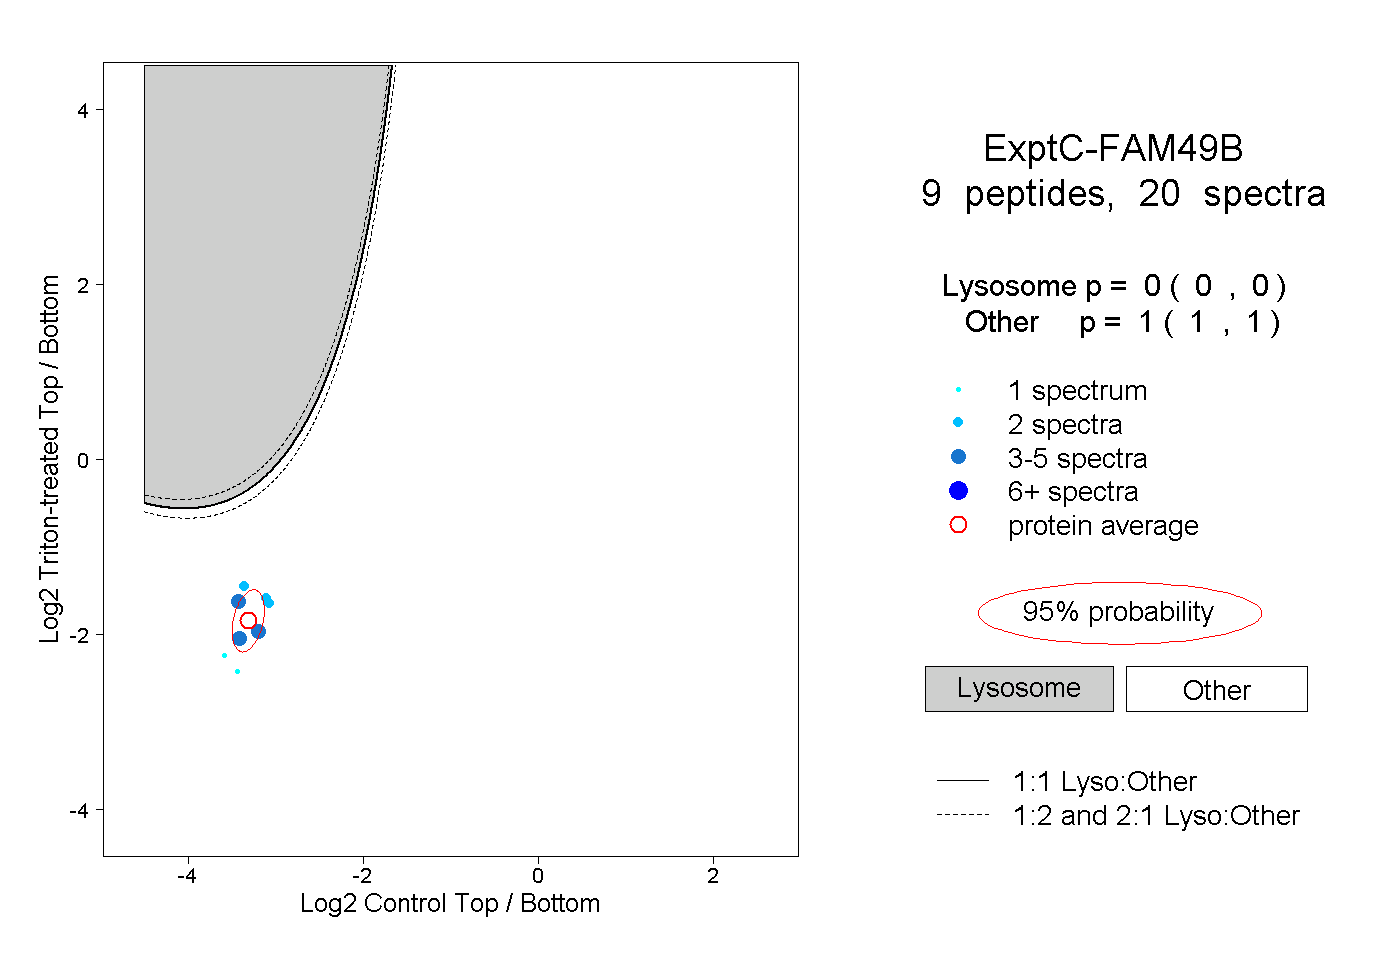
0.000 | 0.000
1.000 | 1.000
2peptides
spectra
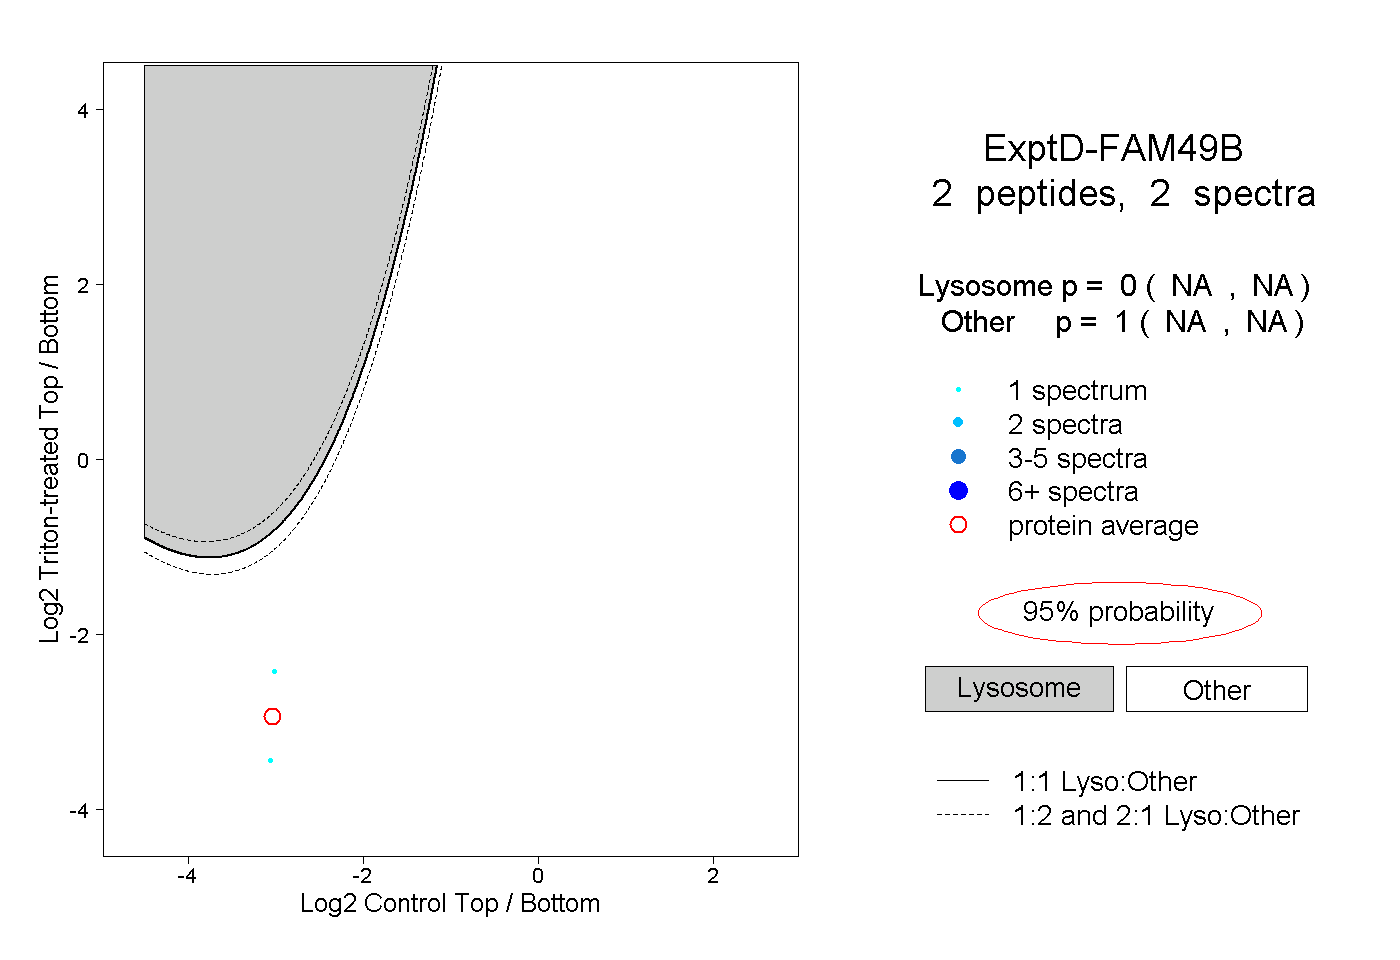
NA | NA
NA | NA