 10
10peptides
spectra
0.000 | 0.000
0.168 | 0.190
0.000 | 0.000
0.000 | 0.000
0.000 | 0.022
0.000 | 0.011
0.798 | 0.816
0.000 | 0.000
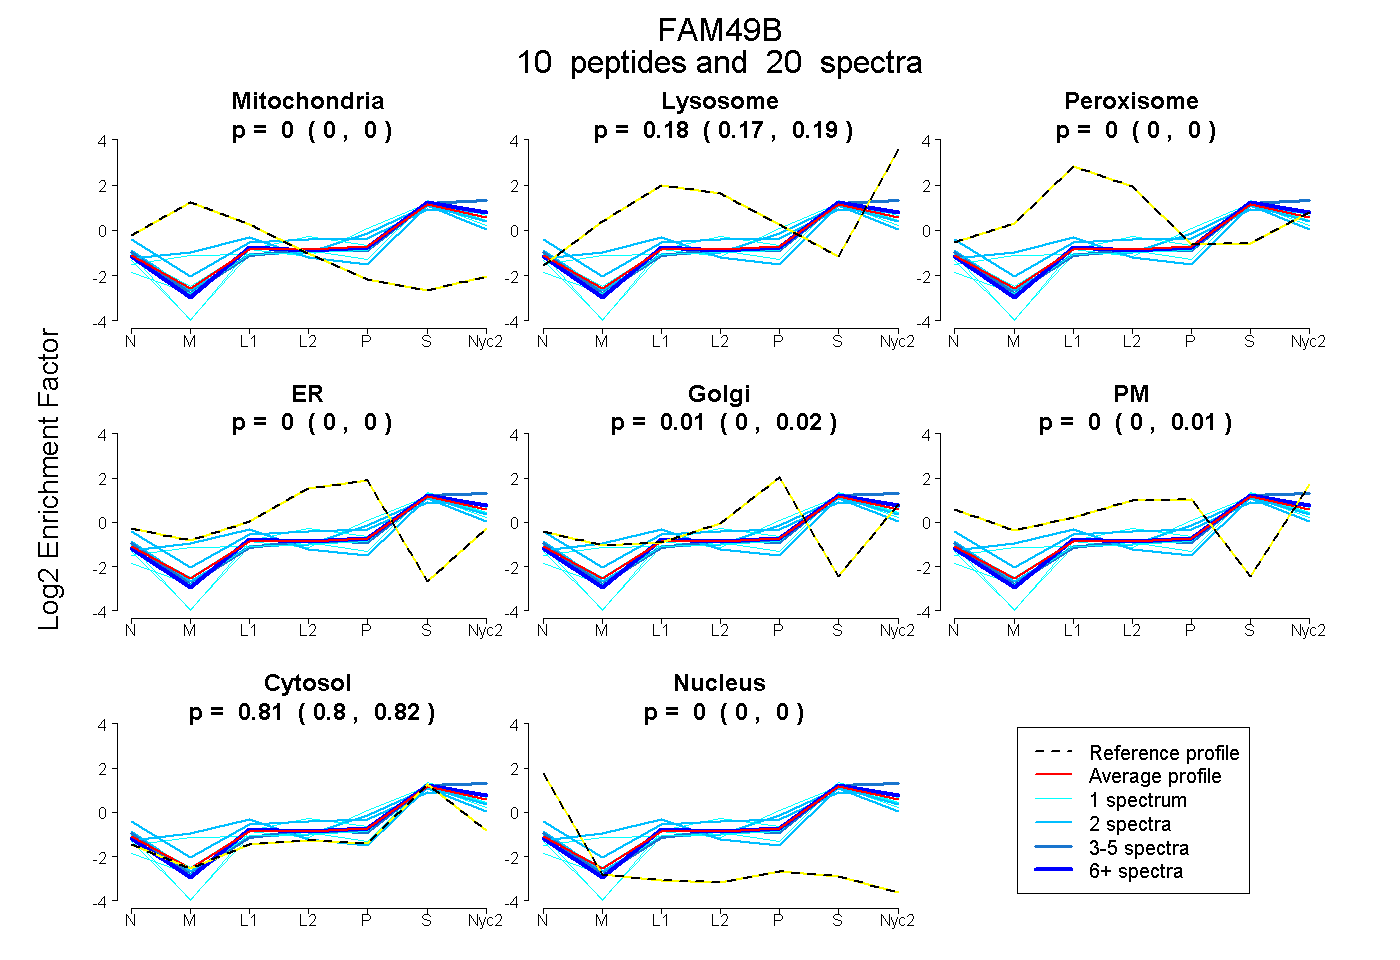
| Plot | Mito | Lyso | Perox | ER | Golgi | PM | Cytosol | Nucleus | |||||
| Expt A |
10 peptides |
20 spectra |
|
0.000 0.000 | 0.000 |
0.181 0.168 | 0.190 |
0.000 0.000 | 0.000 |
0.000 0.000 | 0.000 |
0.011 0.000 | 0.022 |
0.000 0.000 | 0.011 |
0.808 0.798 | 0.816 |
0.000 0.000 | 0.000 |
| 1 spectrum, MSLFYAEATPMLK | 0.000 | 0.134 | 0.000 | 0.000 | 0.000 | 0.000 | 0.866 | 0.000 | ||
| 1 spectrum, DQPPNSVEGLLNALR | 0.000 | 0.083 | 0.000 | 0.000 | 0.000 | 0.000 | 0.917 | 0.000 | ||
| 2 spectra, MTNPAIQNDFSYYR | 0.079 | 0.220 | 0.000 | 0.000 | 0.000 | 0.000 | 0.701 | 0.000 | ||
| 6 spectra, VMLETPEYR | 0.000 | 0.183 | 0.000 | 0.000 | 0.000 | 0.000 | 0.817 | 0.000 | ||
| 2 spectra, DAEGILEDLQSYR | 0.000 | 0.041 | 0.000 | 0.000 | 0.179 | 0.000 | 0.780 | 0.000 | ||
| 2 spectra, QFAEILHFTLR | 0.000 | 0.154 | 0.000 | 0.000 | 0.000 | 0.186 | 0.660 | 0.000 | ||
| 1 spectrum, EAIQHPADEK | 0.000 | 0.185 | 0.000 | 0.000 | 0.000 | 0.035 | 0.780 | 0.000 | ||
| 1 spectrum, EFAEILHFTLR | 0.000 | 0.229 | 0.000 | 0.000 | 0.000 | 0.000 | 0.771 | 0.000 | ||
| 1 spectrum, AWGAVVPLVGK | 0.000 | 0.000 | 0.000 | 0.000 | 0.176 | 0.000 | 0.824 | 0.000 | ||
| 3 spectra, LEAALR | 0.000 | 0.210 | 0.000 | 0.000 | 0.000 | 0.000 | 0.790 | 0.000 |
| Plot | Mito | Lyso or Perox | ER | Golgi | PM | Cytosol | Nucleus | ||||||
| Expt B |
1 peptide |
1 spectrum |
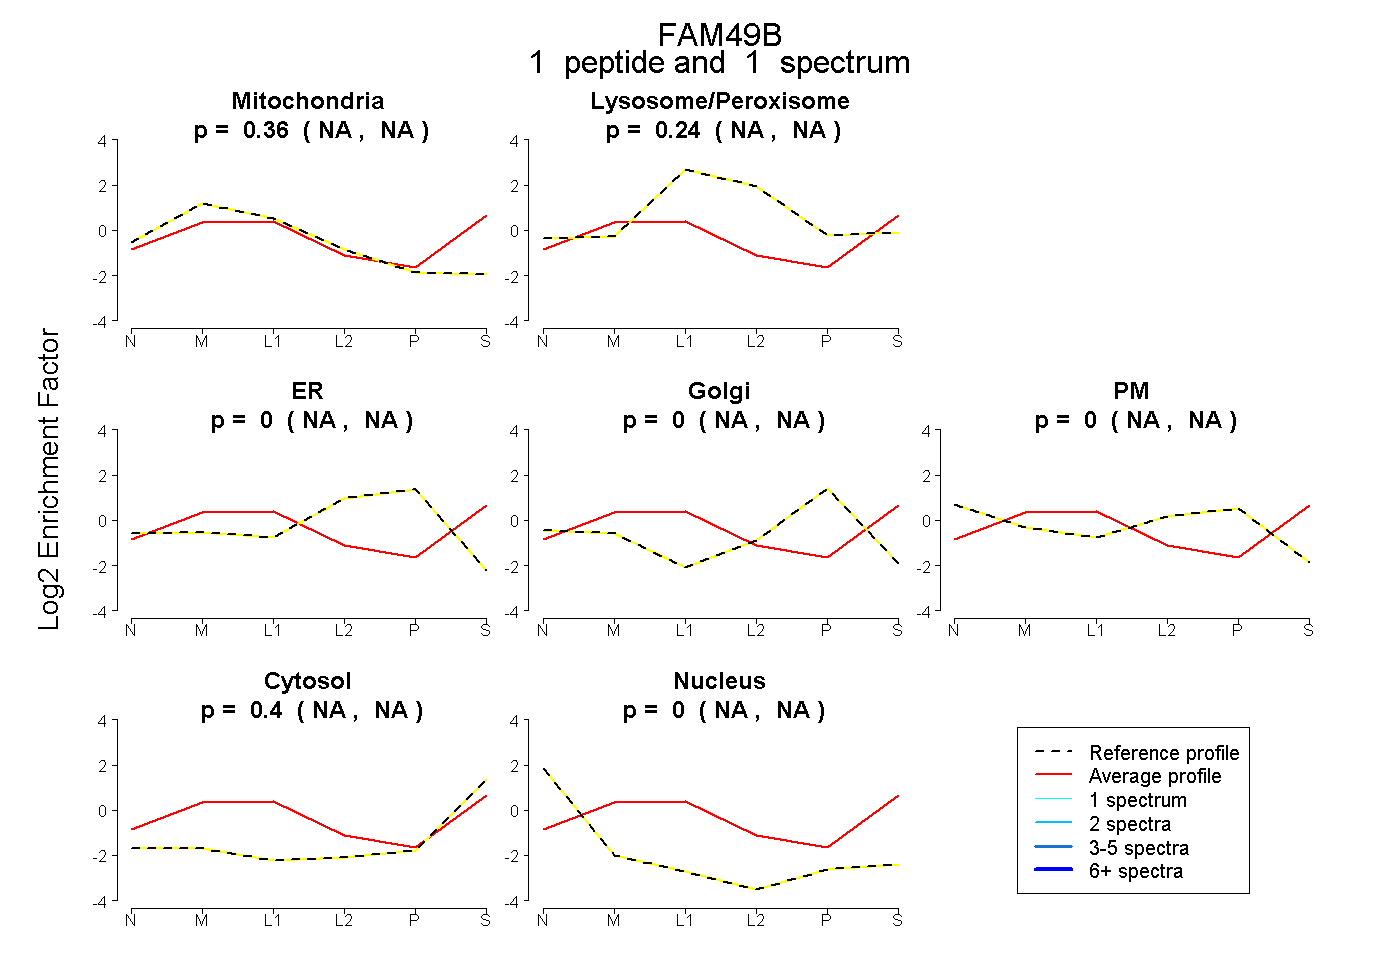 |
0.363 NA | NA |
0.235 NA | NA |
0.000 NA | NA |
0.000 NA | NA |
0.000 NA | NA |
0.402 NA | NA |
0.000 NA | NA |
|||
| Plot | Lyso | Other | |||||||||||
| Expt C |
9 peptides |
20 spectra |
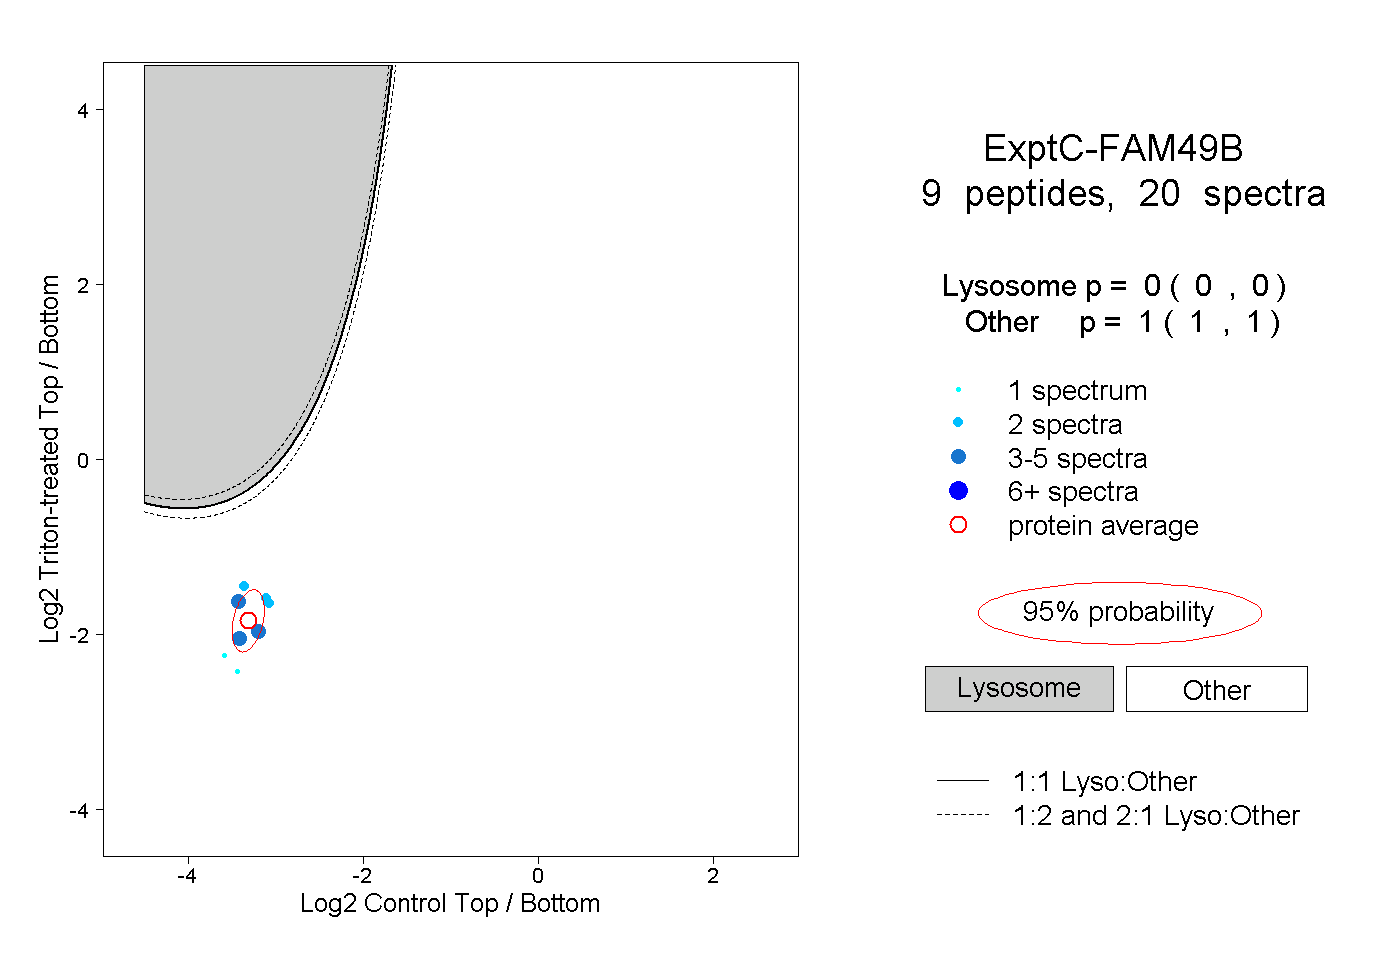 |
0.000 0.000 | 0.000 |
1.000 1.000 | 1.000 |
||||||||
| Plot | Lyso | Other | |||||||||||
| Expt D |
2 peptides |
2 spectra |
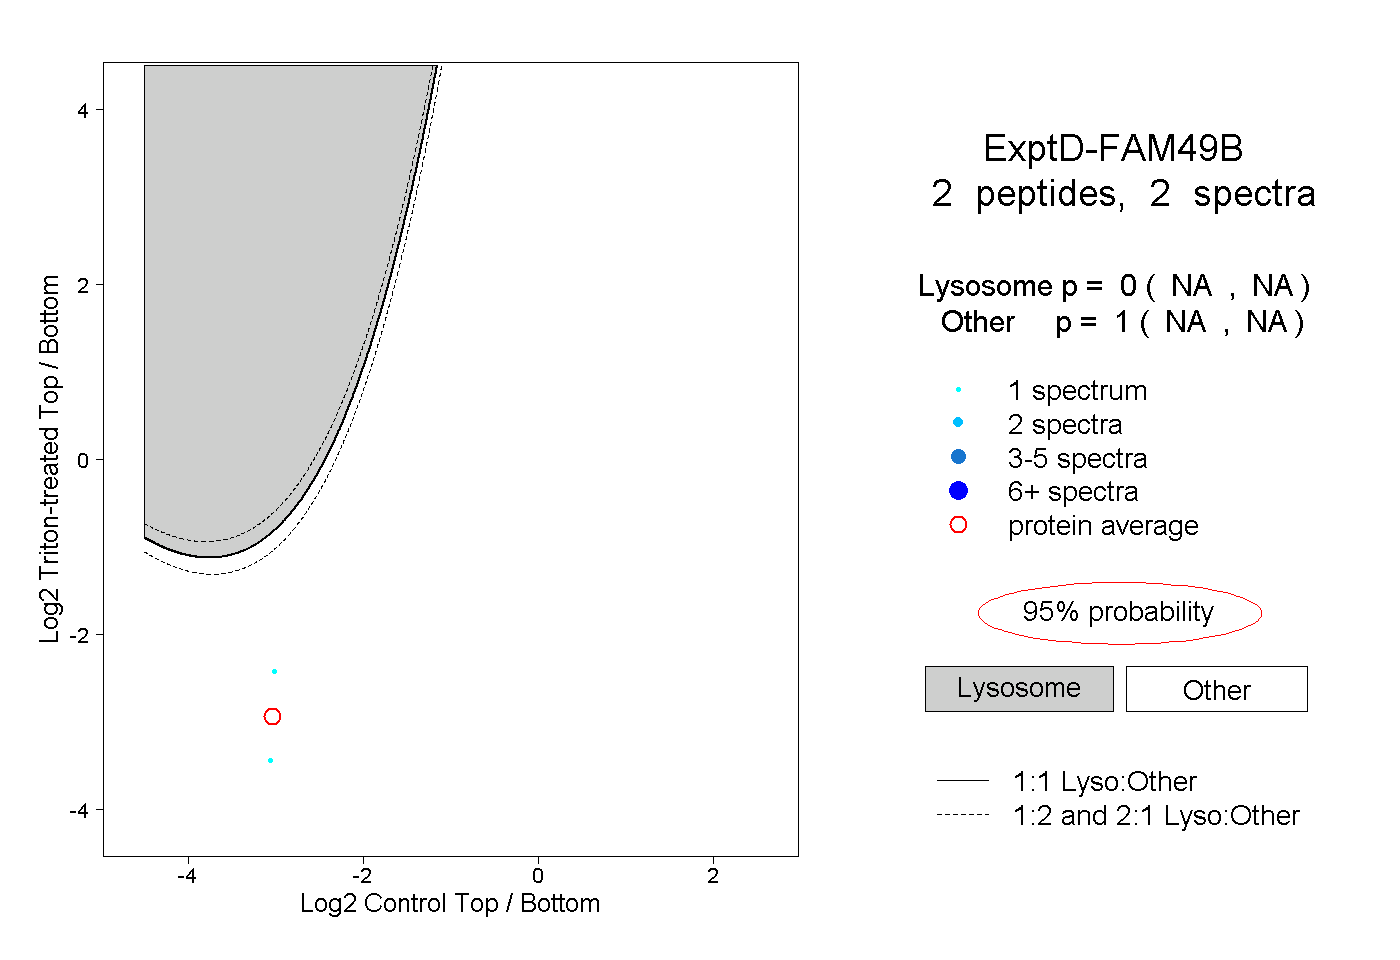 |
0.000 NA | NA |
1.000 NA | NA |