 6
6peptides
spectra
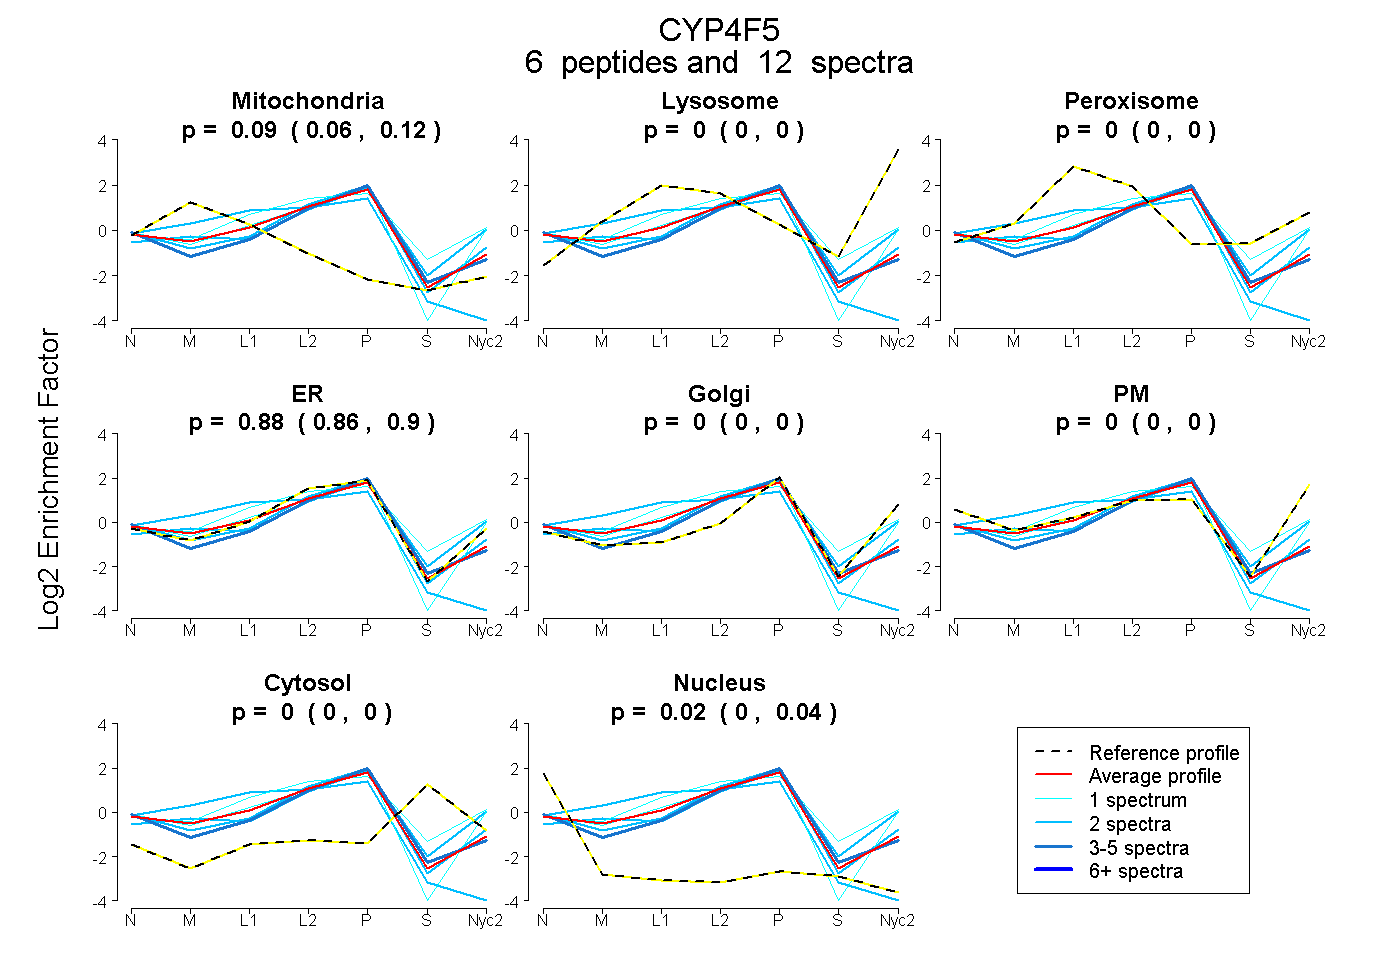
0.065 | 0.116
0.000 | 0.000
0.000 | 0.000
0.858 | 0.900
0.000 | 0.000
0.000 | 0.000
0.000 | 0.000
0.000 | 0.044
1peptide
spectrum
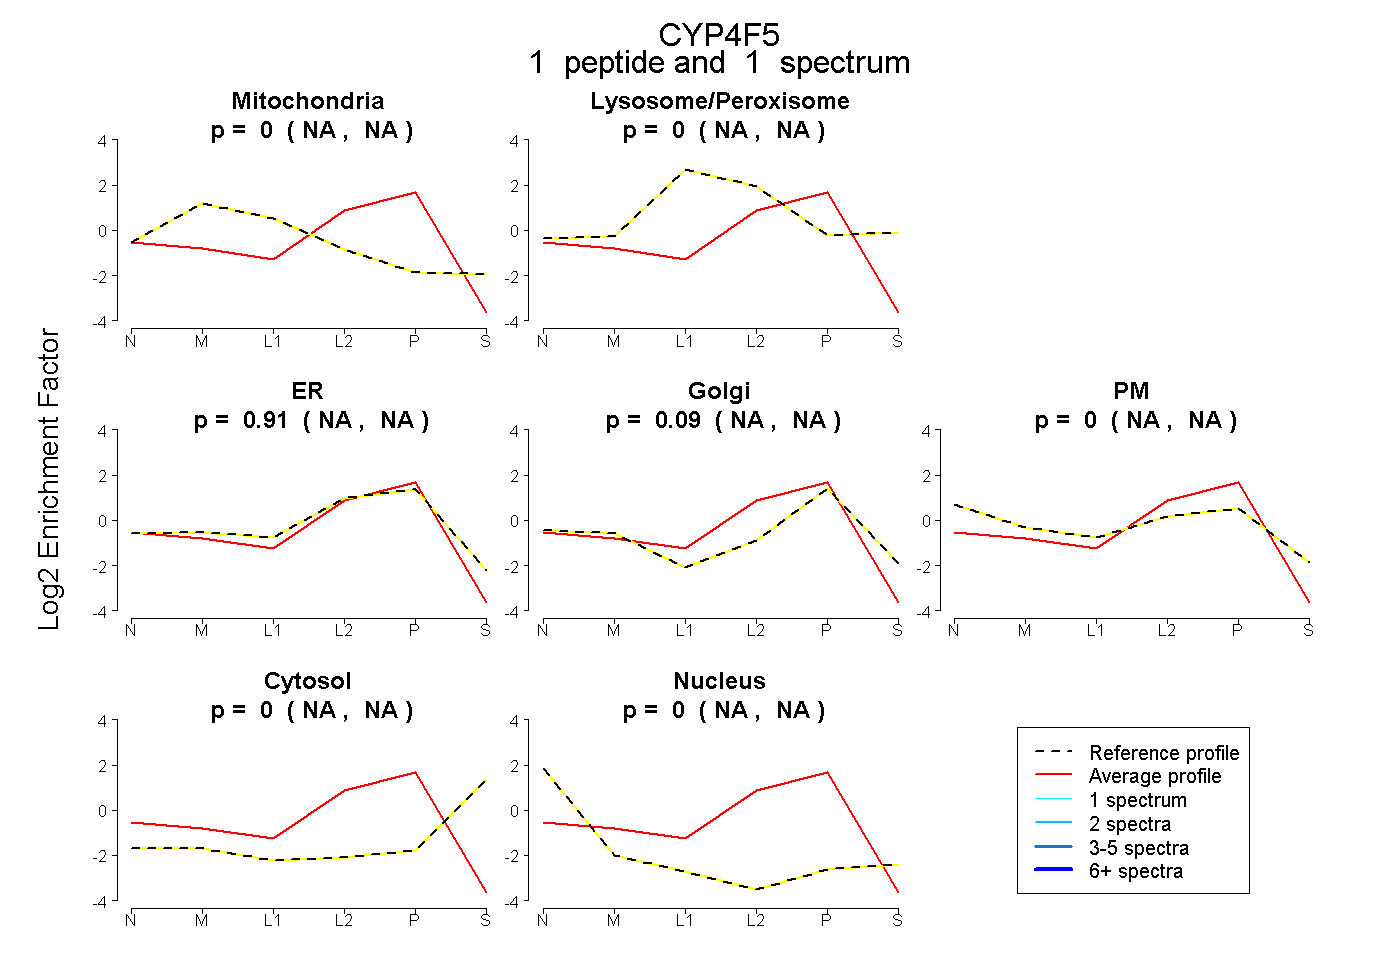
NA | NA
NA | NA
NA | NA
NA | NA
NA | NA
NA | NA
NA | NA
2peptides
spectra
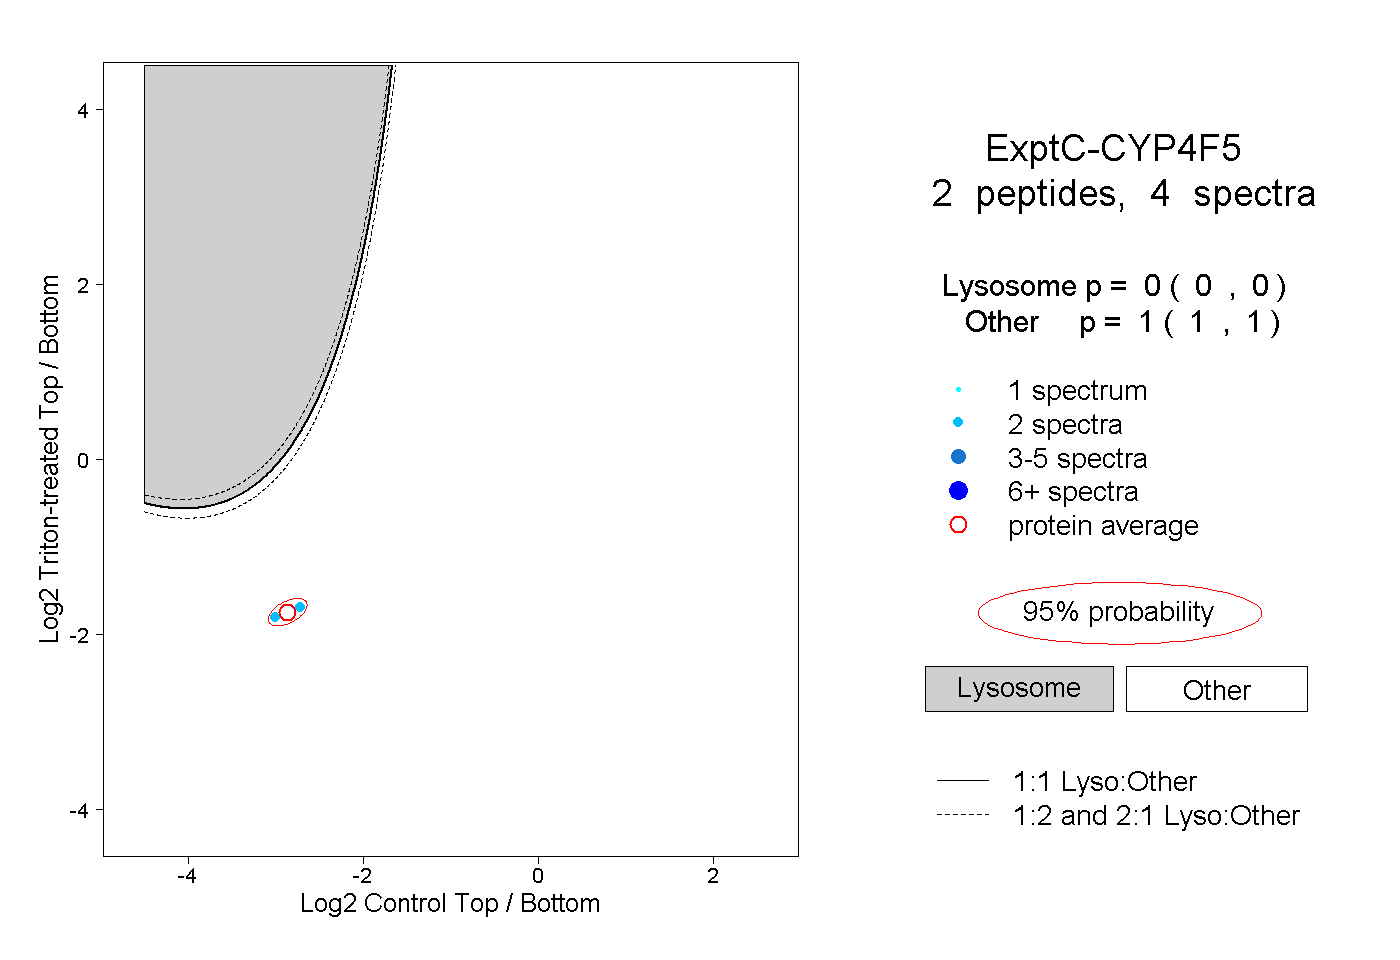
0.000 | 0.000
1.000 | 1.000