 6
6peptides
spectra
0.065 | 0.116
0.000 | 0.000
0.000 | 0.000
0.858 | 0.900
0.000 | 0.000
0.000 | 0.000
0.000 | 0.000
0.000 | 0.044
| Plot | Mito | Lyso | Perox | ER | Golgi | PM | Cytosol | Nucleus | |||||
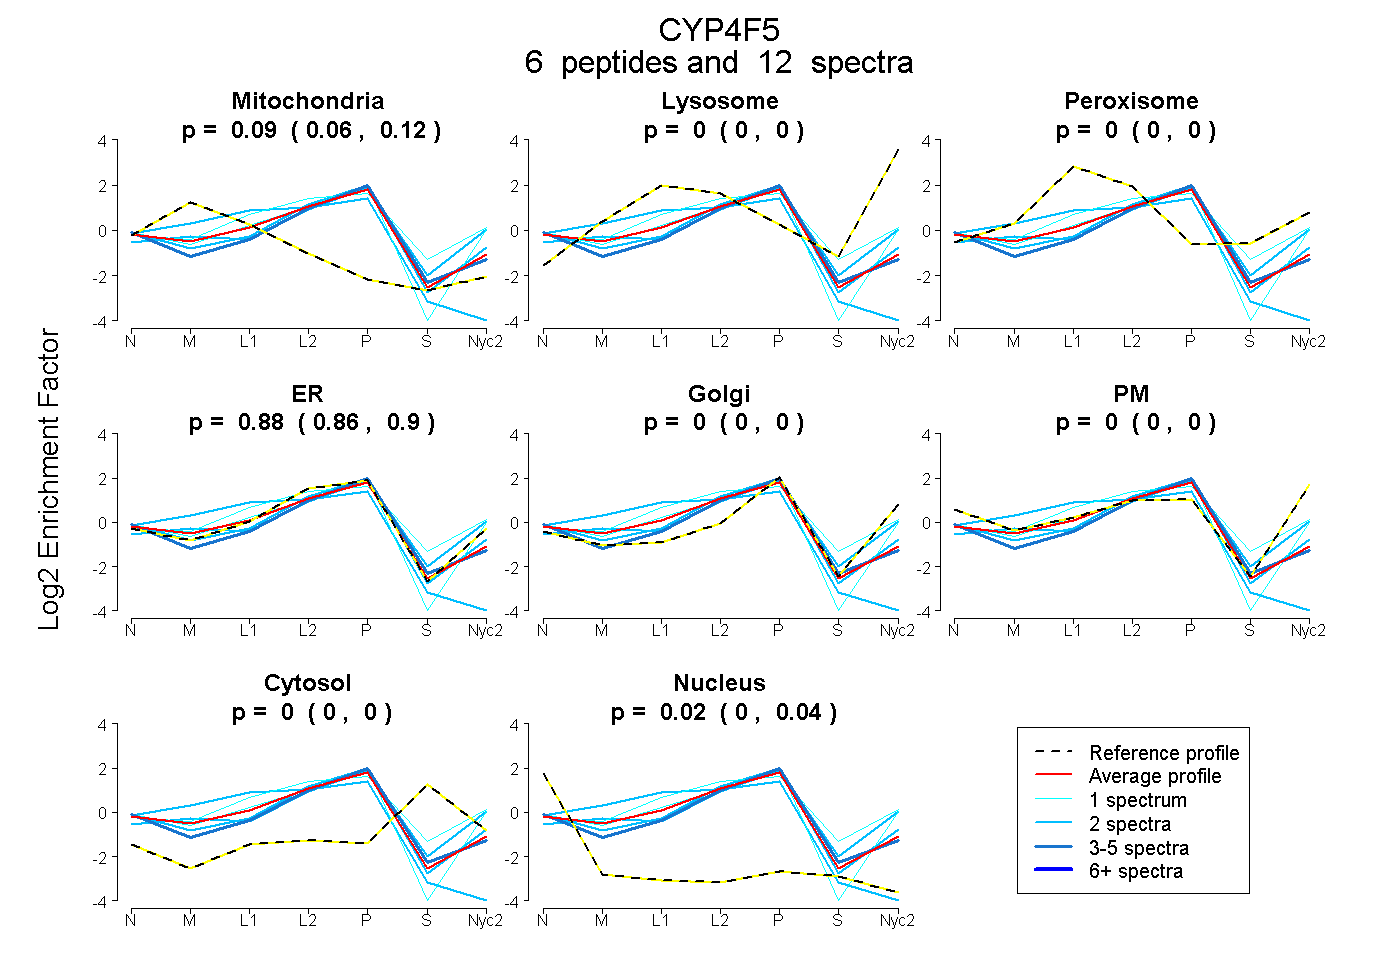
| Expt A |
6 peptides |
12 spectra |
|
0.094 0.065 | 0.116 |
0.000 0.000 | 0.000 |
0.000 0.000 | 0.000 |
0.882 0.858 | 0.900 |
0.000 0.000 | 0.000 |
0.000 0.000 | 0.000 |
0.000 0.000 | 0.000 |
0.024 0.000 | 0.044 |
| 1 spectrum, LVTEMGQTFR | 0.014 | 0.000 | 0.000 | 0.824 | 0.076 | 0.087 | 0.000 | 0.000 | ||
| 1 spectrum, QEVWELLR | 0.000 | 0.000 | 0.296 | 0.526 | 0.151 | 0.000 | 0.027 | 0.000 | ||
| 2 spectra, LHPPAIDLLR | 0.000 | 0.000 | 0.000 | 0.936 | 0.000 | 0.000 | 0.000 | 0.064 | ||
| 4 spectra, TLDFIDVLLLAK | 0.000 | 0.000 | 0.000 | 0.878 | 0.000 | 0.000 | 0.021 | 0.101 | ||
| 2 spectra, IFNQSVNIMHAK | 0.038 | 0.051 | 0.000 | 0.575 | 0.304 | 0.000 | 0.032 | 0.000 | ||
| 2 spectra, ACDLVHNFTDAVIR | 0.405 | 0.000 | 0.000 | 0.595 | 0.000 | 0.000 | 0.000 | 0.000 |
| Plot | Mito | Lyso or Perox | ER | Golgi | PM | Cytosol | Nucleus | ||||||
| Expt B |
1 peptide |
1 spectrum |
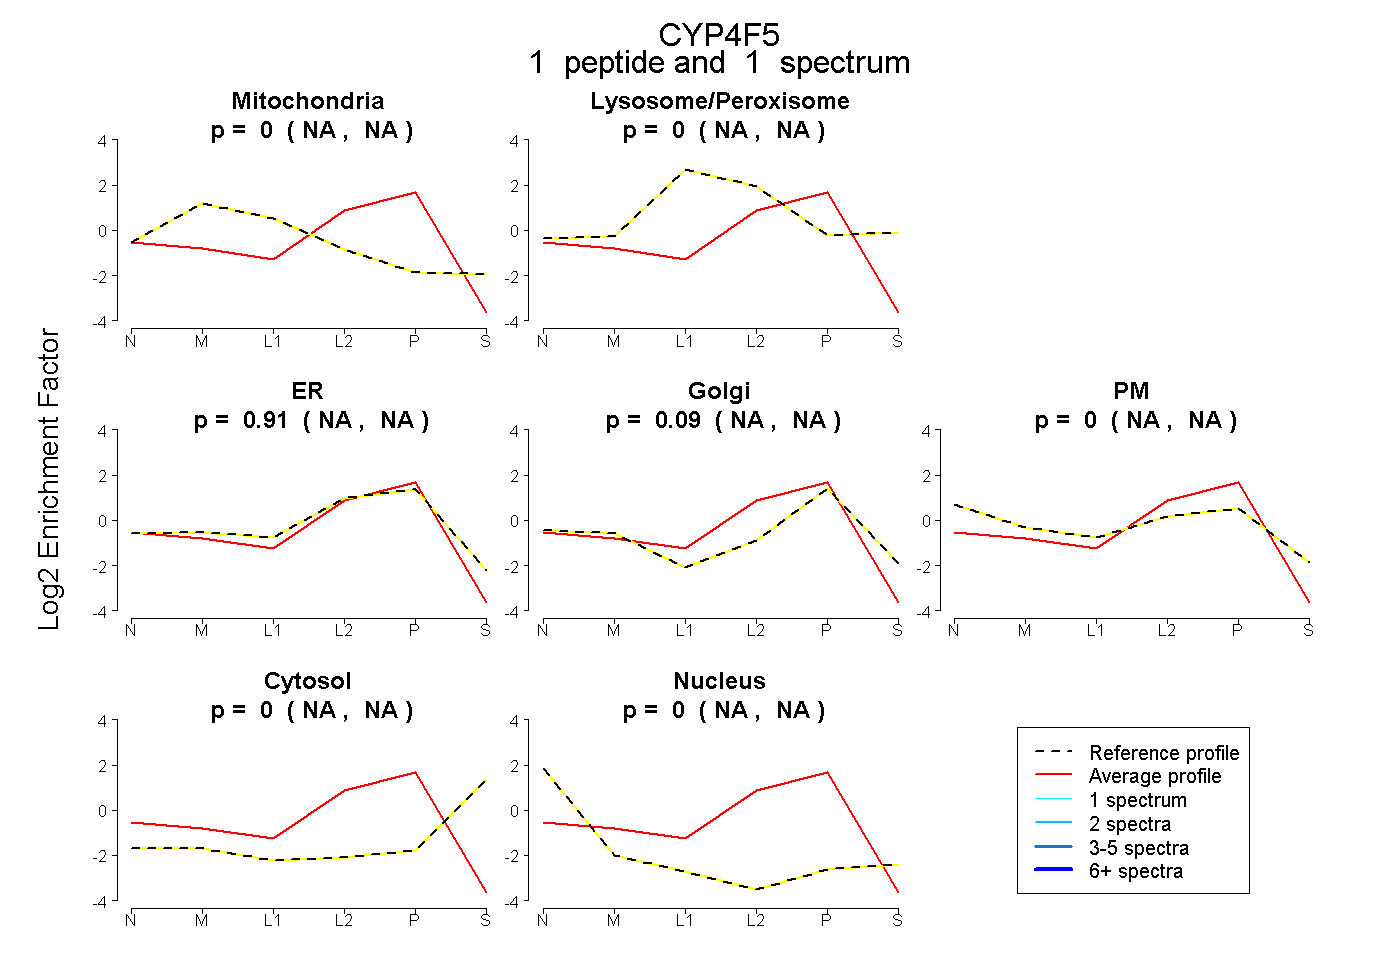 |
0.000 NA | NA |
0.000 NA | NA |
0.909 NA | NA |
0.091 NA | NA |
0.000 NA | NA |
0.000 NA | NA |
0.000 NA | NA |
|||
| Plot | Lyso | Other | |||||||||||
| Expt C |
2 peptides |
4 spectra |
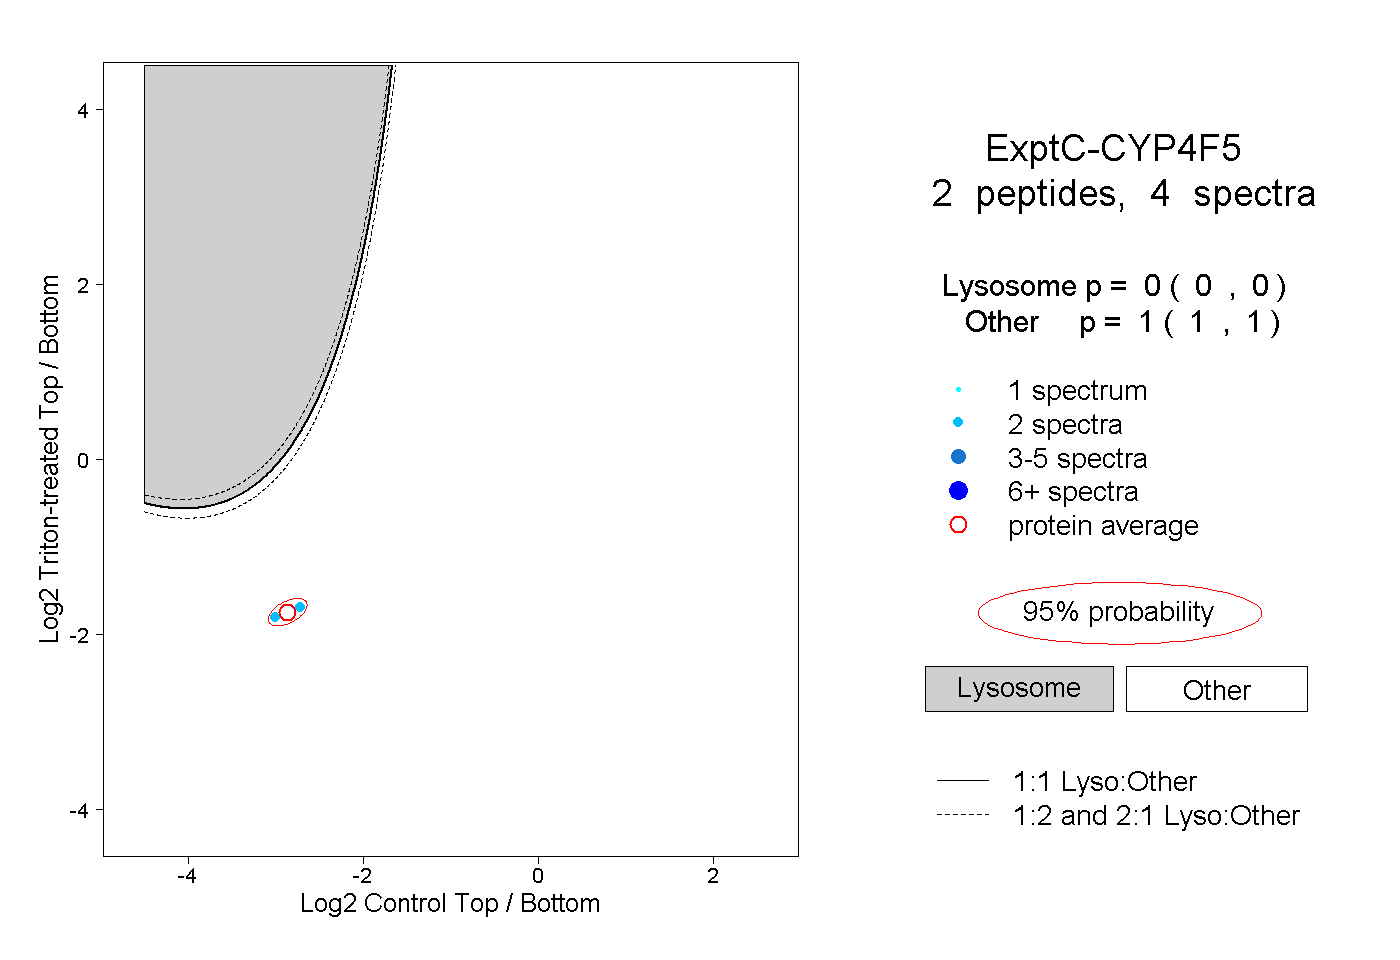 |
0.000 0.000 | 0.000 |
1.000 1.000 | 1.000 |