 4
4peptides
spectra
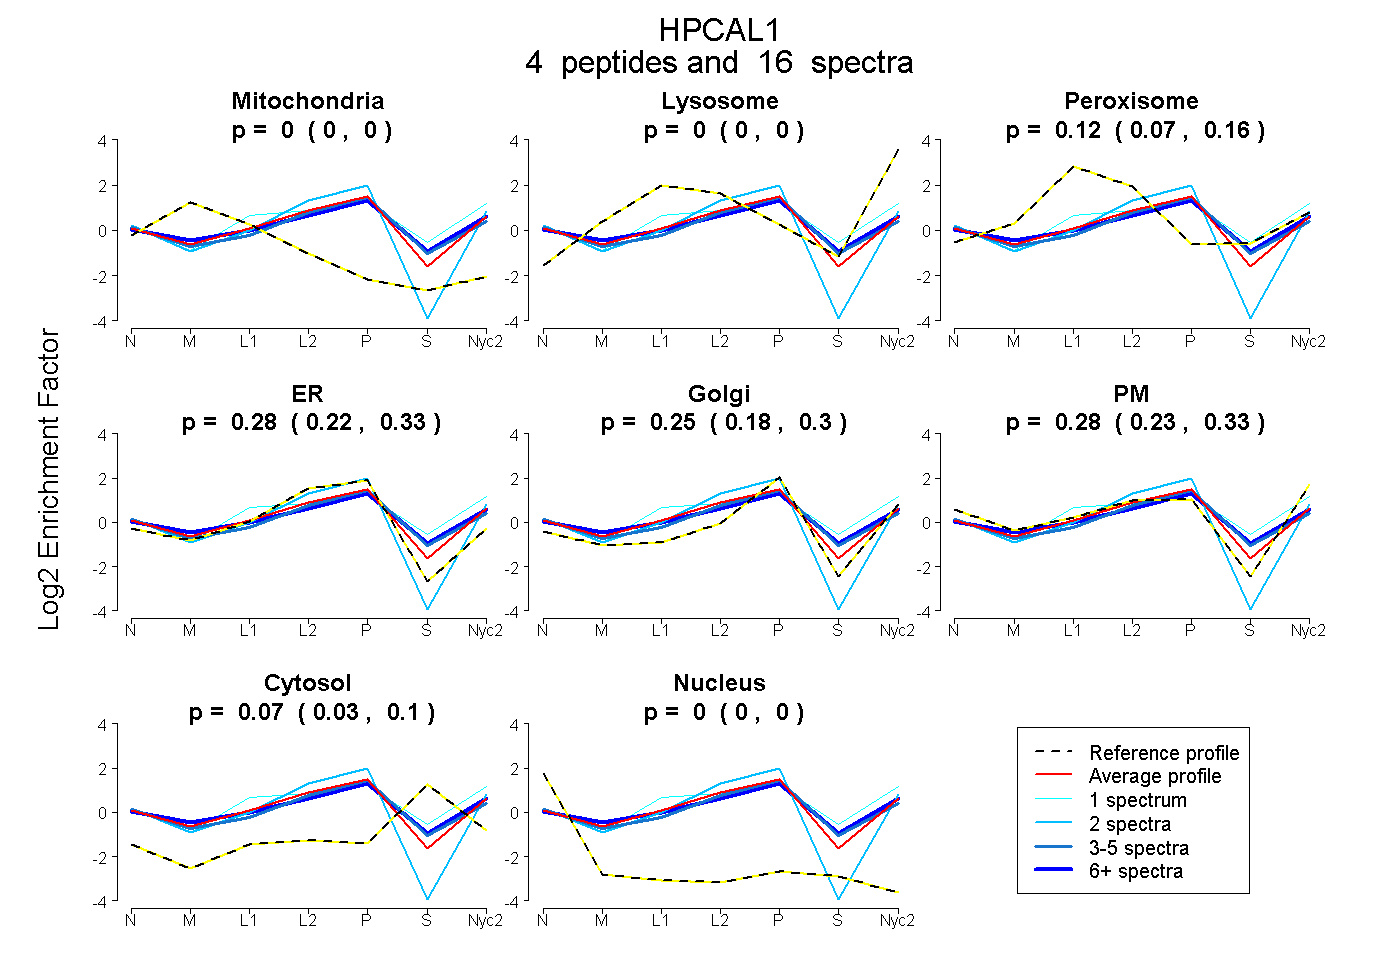
0.000 | 0.000
0.000 | 0.000
0.070 | 0.158
0.224 | 0.333
0.181 | 0.302
0.227 | 0.334
0.034 | 0.096
0.000 | 0.000
3peptides
spectra
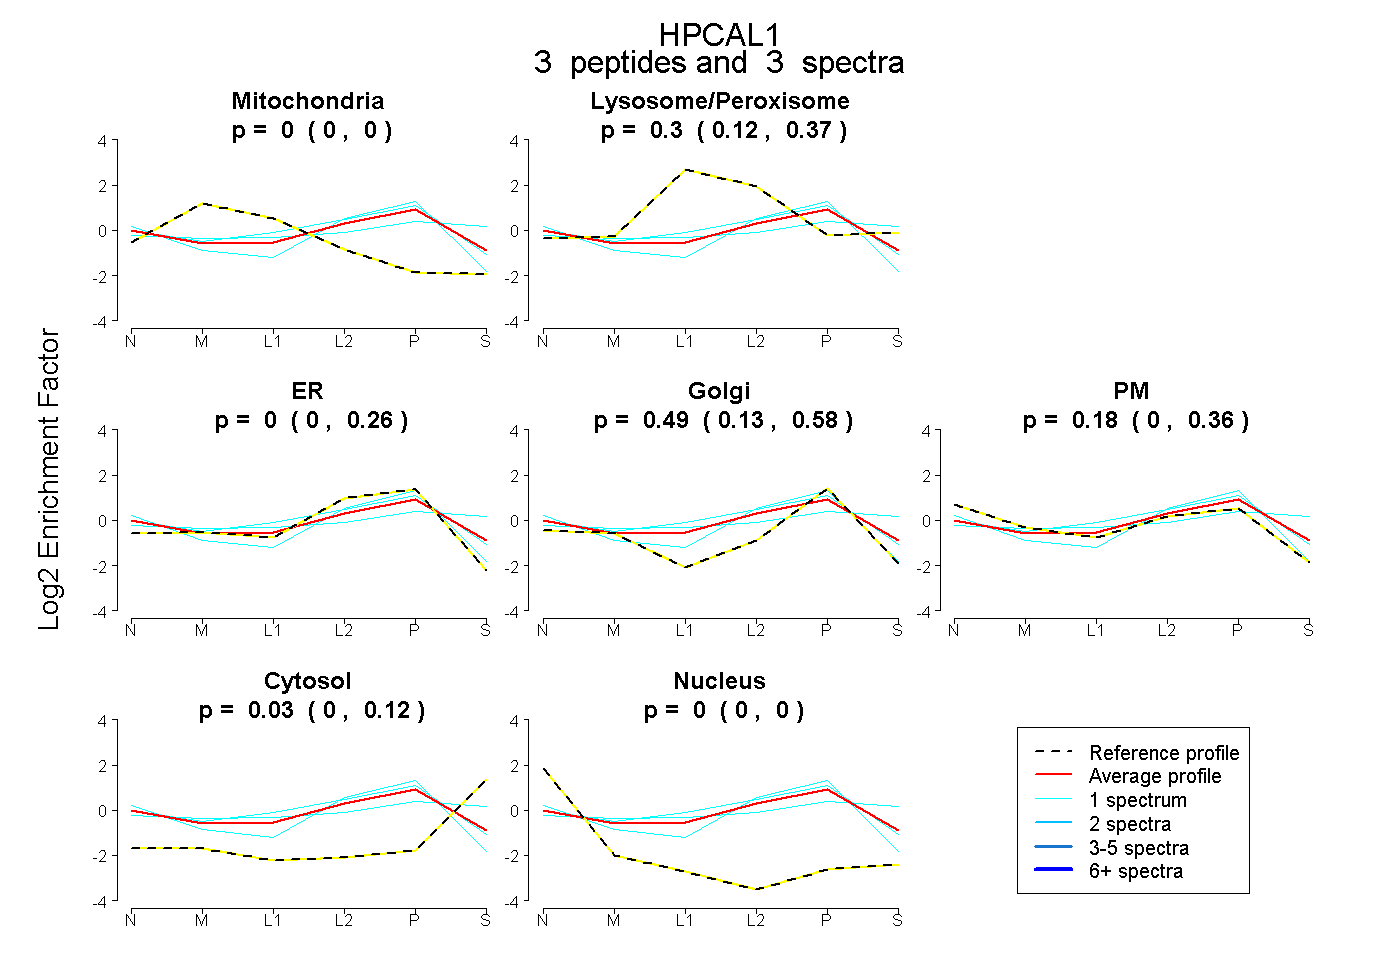
0.000 | 0.000
0.124 | 0.374
0.000 | 0.256
0.129 | 0.582
0.000 | 0.356
0.000 | 0.117
0.000 | 0.000
5peptides
spectra
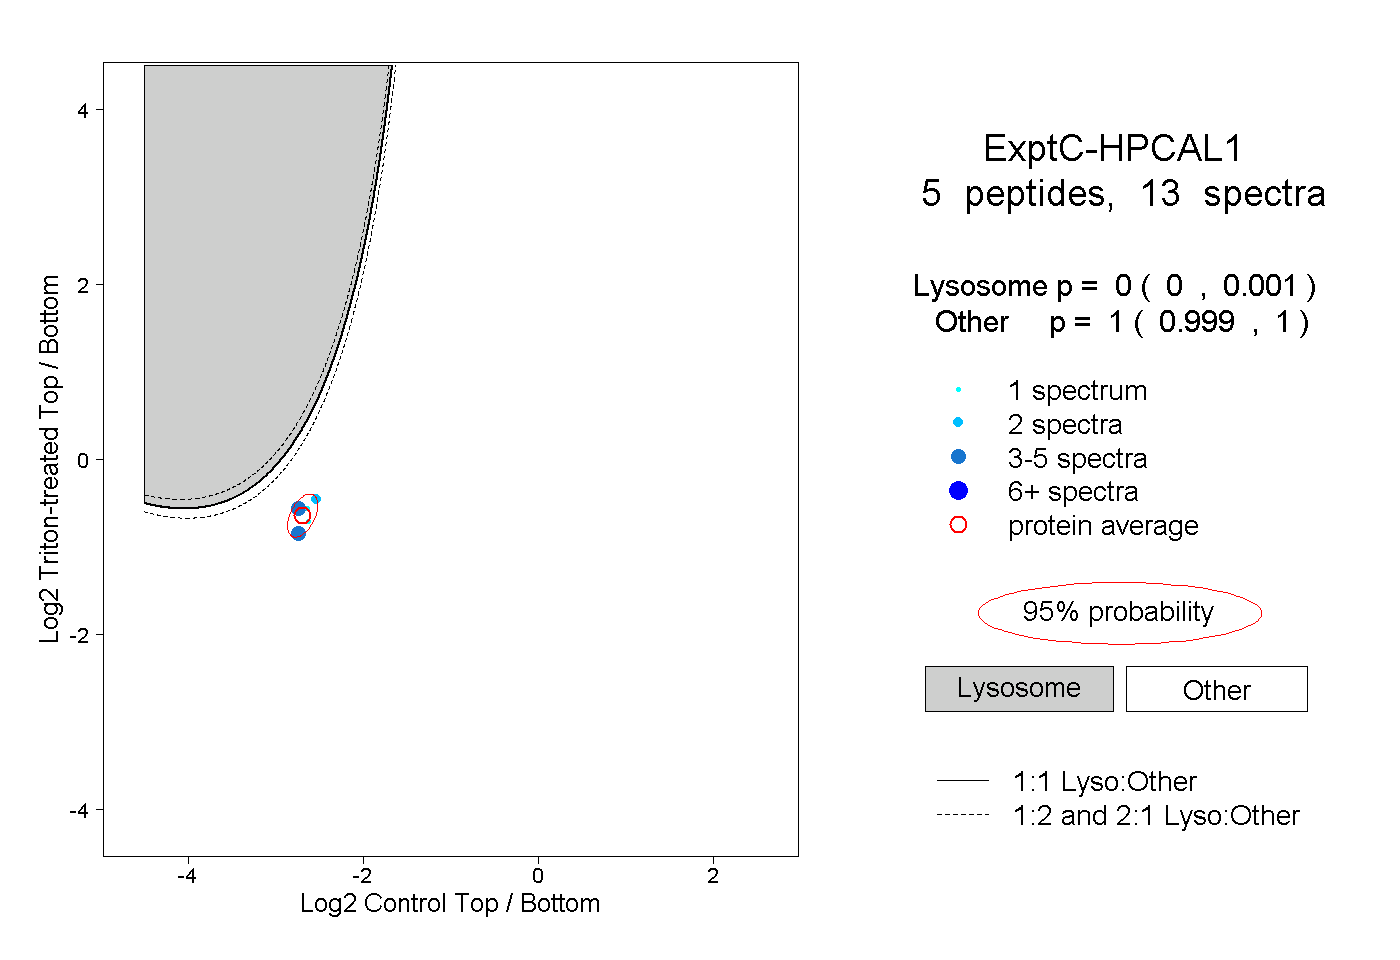
0.000 | 0.001
0.999 | 1.000
1peptide
spectra
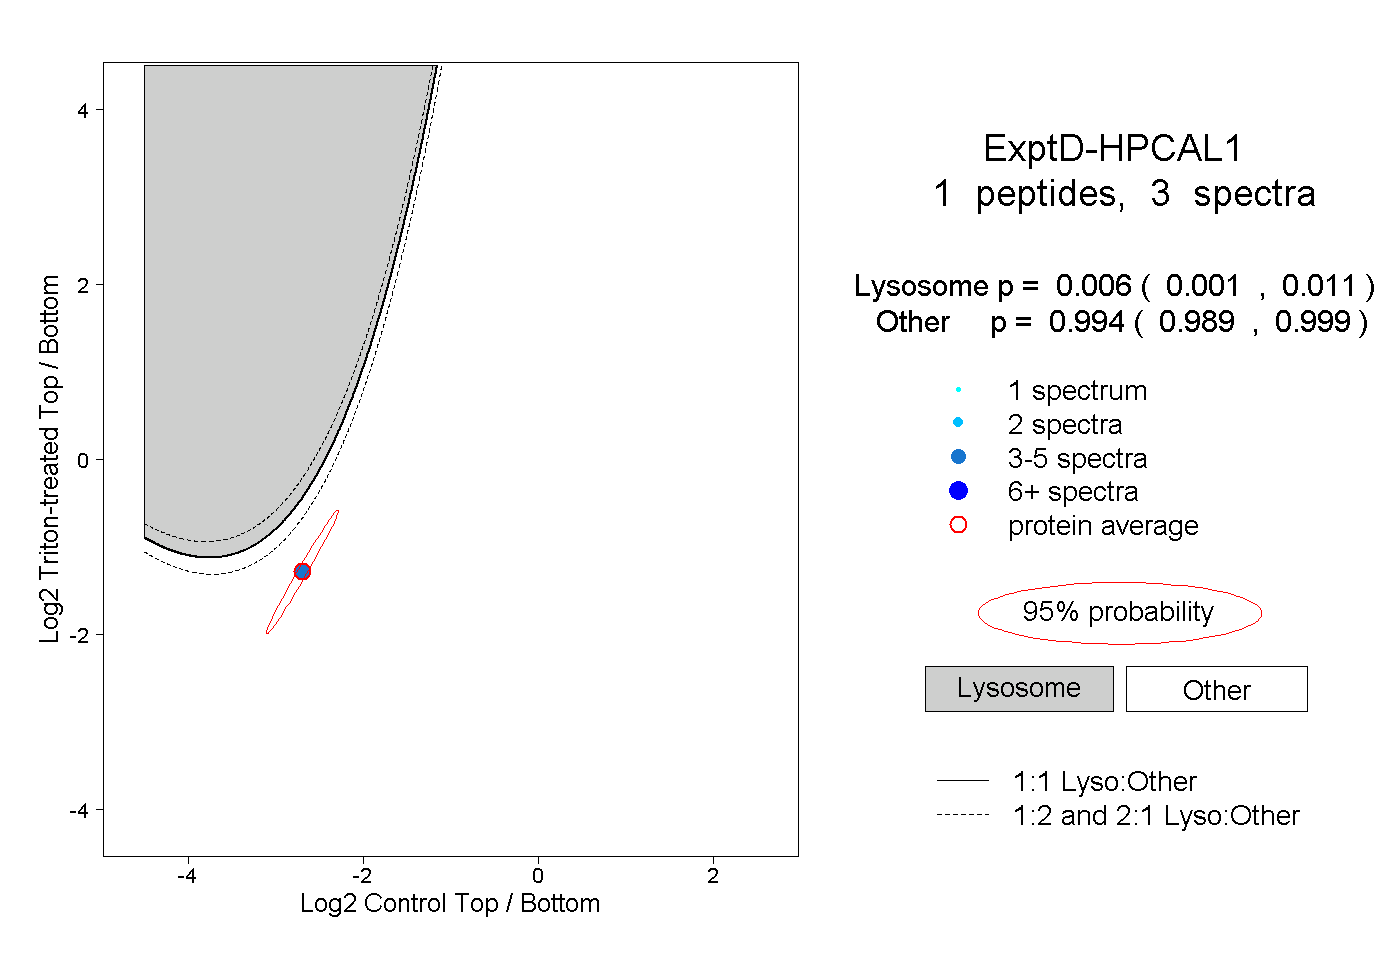
0.001 | 0.011
0.989 | 0.999