HPCAL1
[ENSRNOP00000007374]
Main page
| | | Plot |
Mito |
Lyso |
|
Perox |
ER |
Golgi |
PM |
Cytosol |
Nucleus |
|
| Expt A |
 4
4
peptides |
16
spectra |
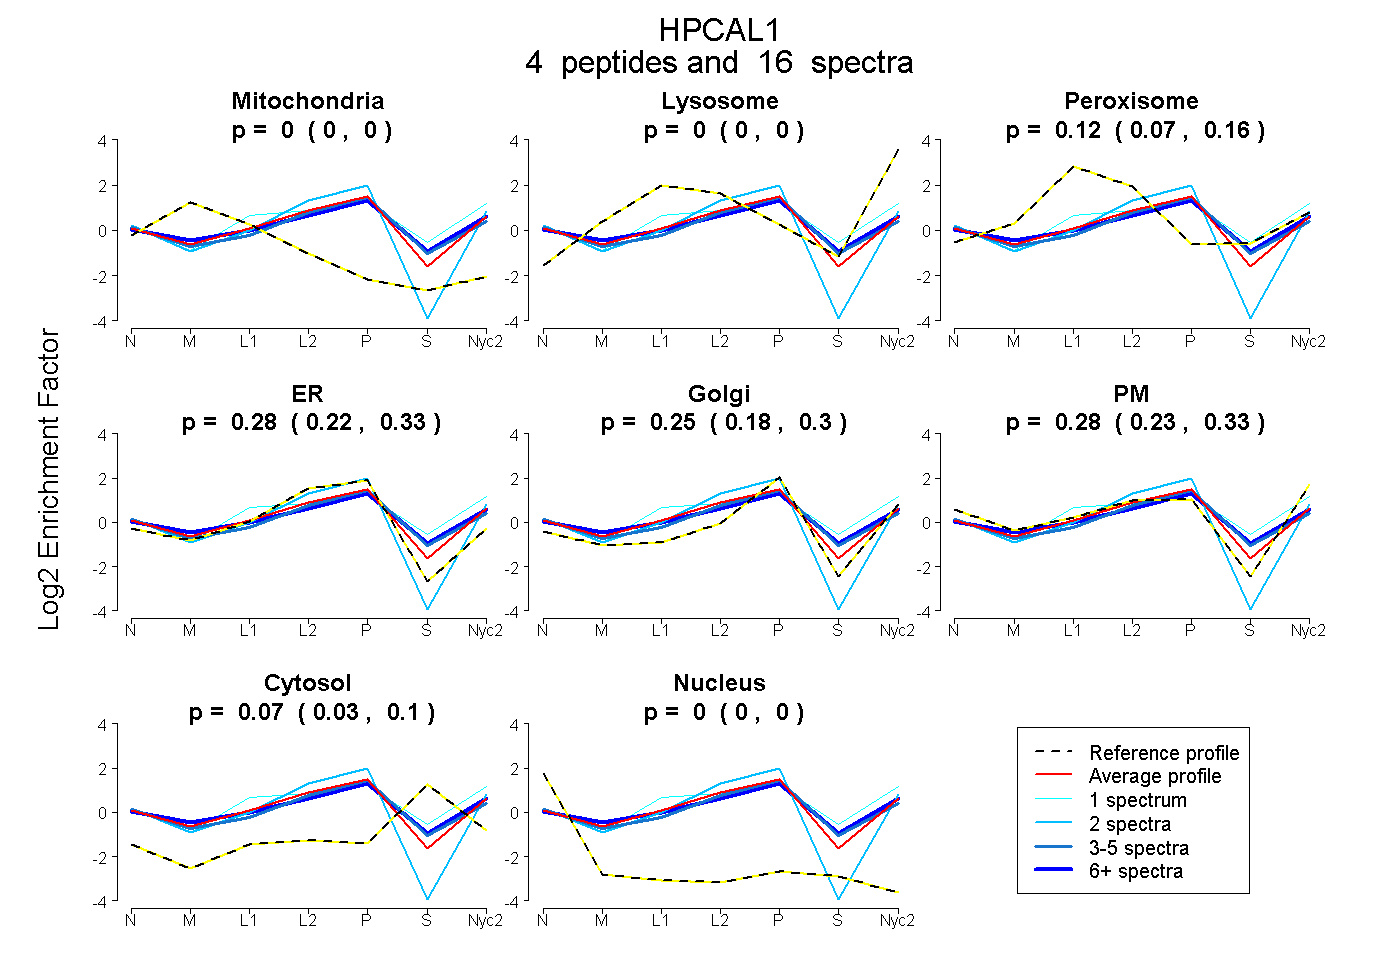 |
0.000
0.000 | 0.000 |
0.000
0.000 | 0.000 |
|
0.120
0.070 | 0.158 |
0.280
0.224 | 0.333 |
0.247
0.181 | 0.302 |
0.284
0.227 | 0.334 |
0.069
0.034 | 0.096 |
0.000
0.000 | 0.000 |
|
| | | Plot |
Mito |
|
Lyso or Perox |
|
ER |
Golgi |
PM |
Cytosol |
Nucleus |
|
| Expt B |
3
peptides |
3
spectra |
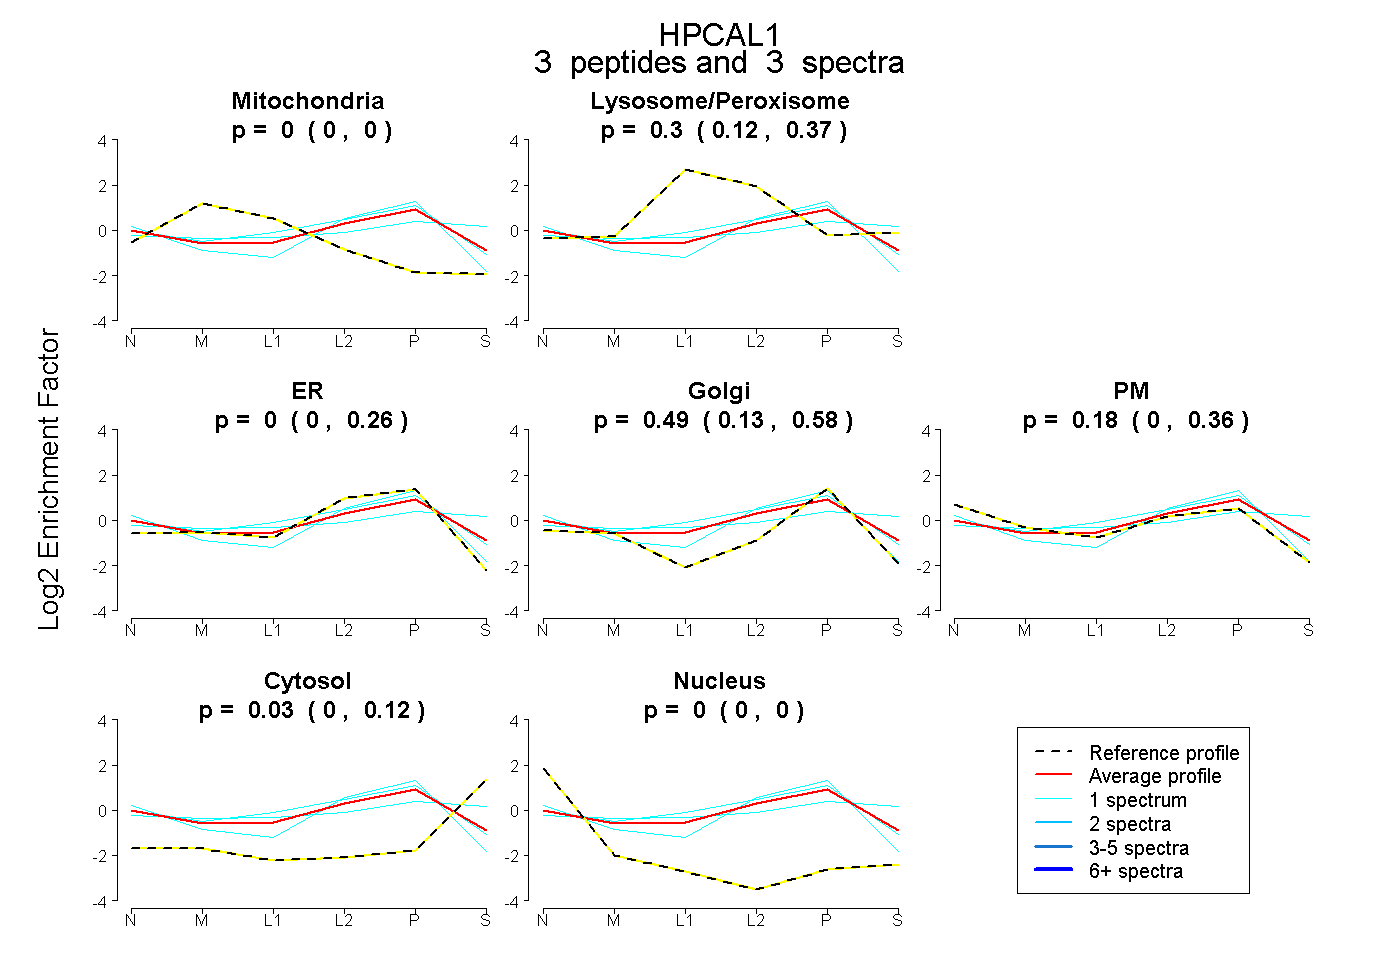 |
0.000
0.000 | 0.000 |
|
0.304
0.124 | 0.374 |
|
0.000
0.000 | 0.256 |
0.488
0.129 | 0.582 |
0.180
0.000 | 0.356 |
0.028
0.000 | 0.117 |
0.000
0.000 | 0.000 |
|
| 1 spectrum, SDPSIVR |
0.000 |
|
0.369 |
|
0.000 |
0.312 |
0.082 |
0.237 |
0.000 |
|
| 1 spectrum, LSLEEFIK |
0.000 |
|
0.000 |
|
0.454 |
0.182 |
0.364 |
0.000 |
0.000 |
|
| 1 spectrum, LRPEVLQDLR |
0.000 |
|
0.350 |
|
0.078 |
0.425 |
0.147 |
0.000 |
0.000 |
|
| | | Plot |
|
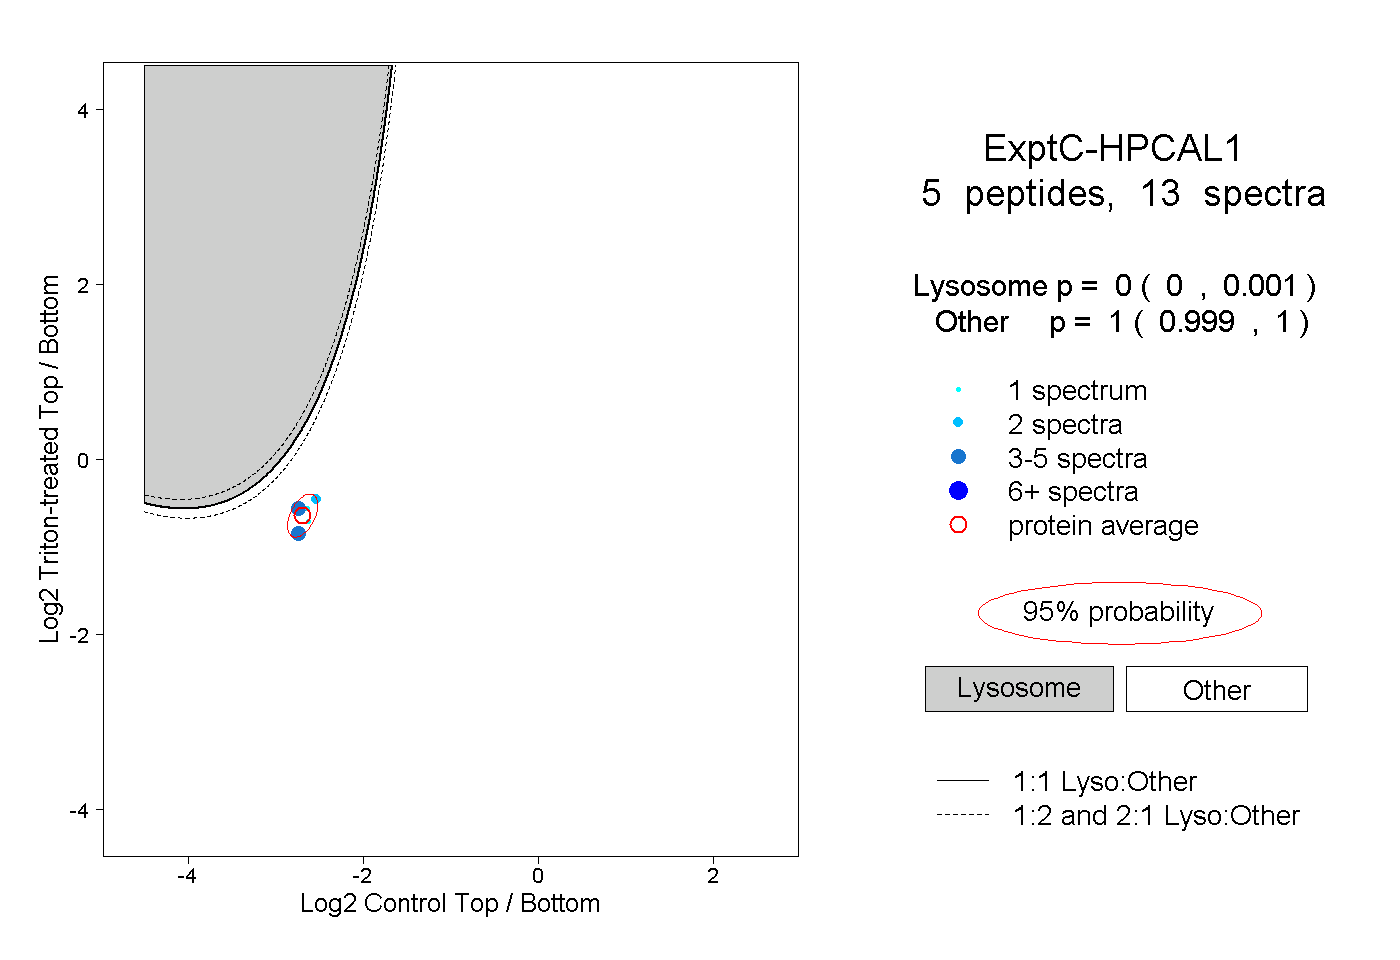
Lyso |
|
|
|
|
|
|
|
Other |
| Expt C |
5
peptides |
13
spectra |
 |
|
0.000
0.000 | 0.001 |
|
|
|
|
|
|
|
1.000
0.999 | 1.000 |
| | | Plot |
|
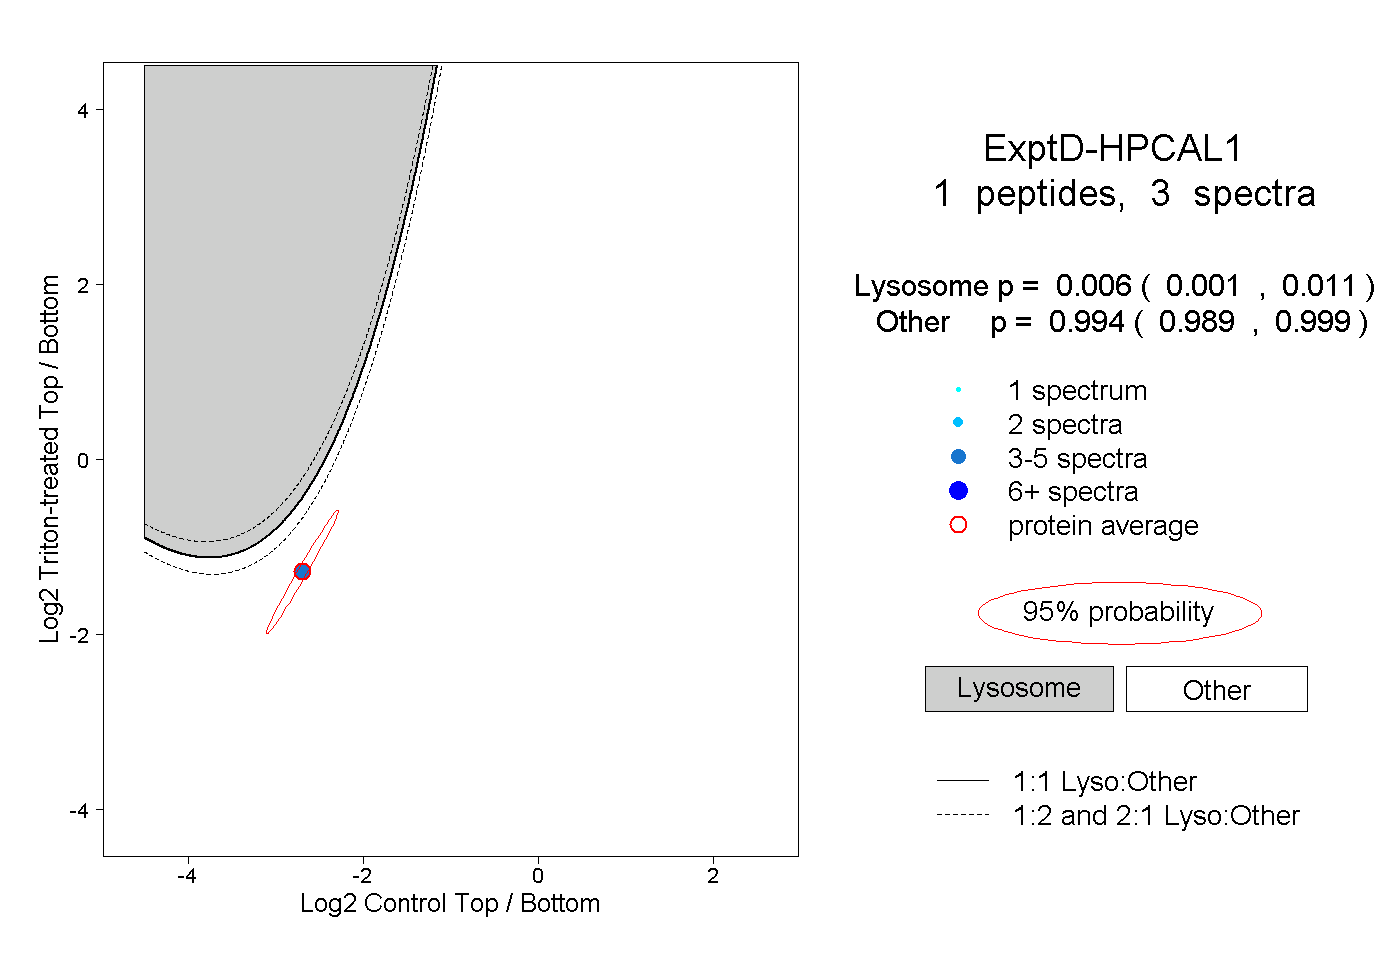
Lyso |
|
|
|
|
|
|
|
Other |
| Expt D |
1
peptide |
3
spectra |
 |
|
0.006
0.001 | 0.011 |
|
|
|
|
|
|
|
0.994
0.989 | 0.999 |