 12
12peptides
spectra
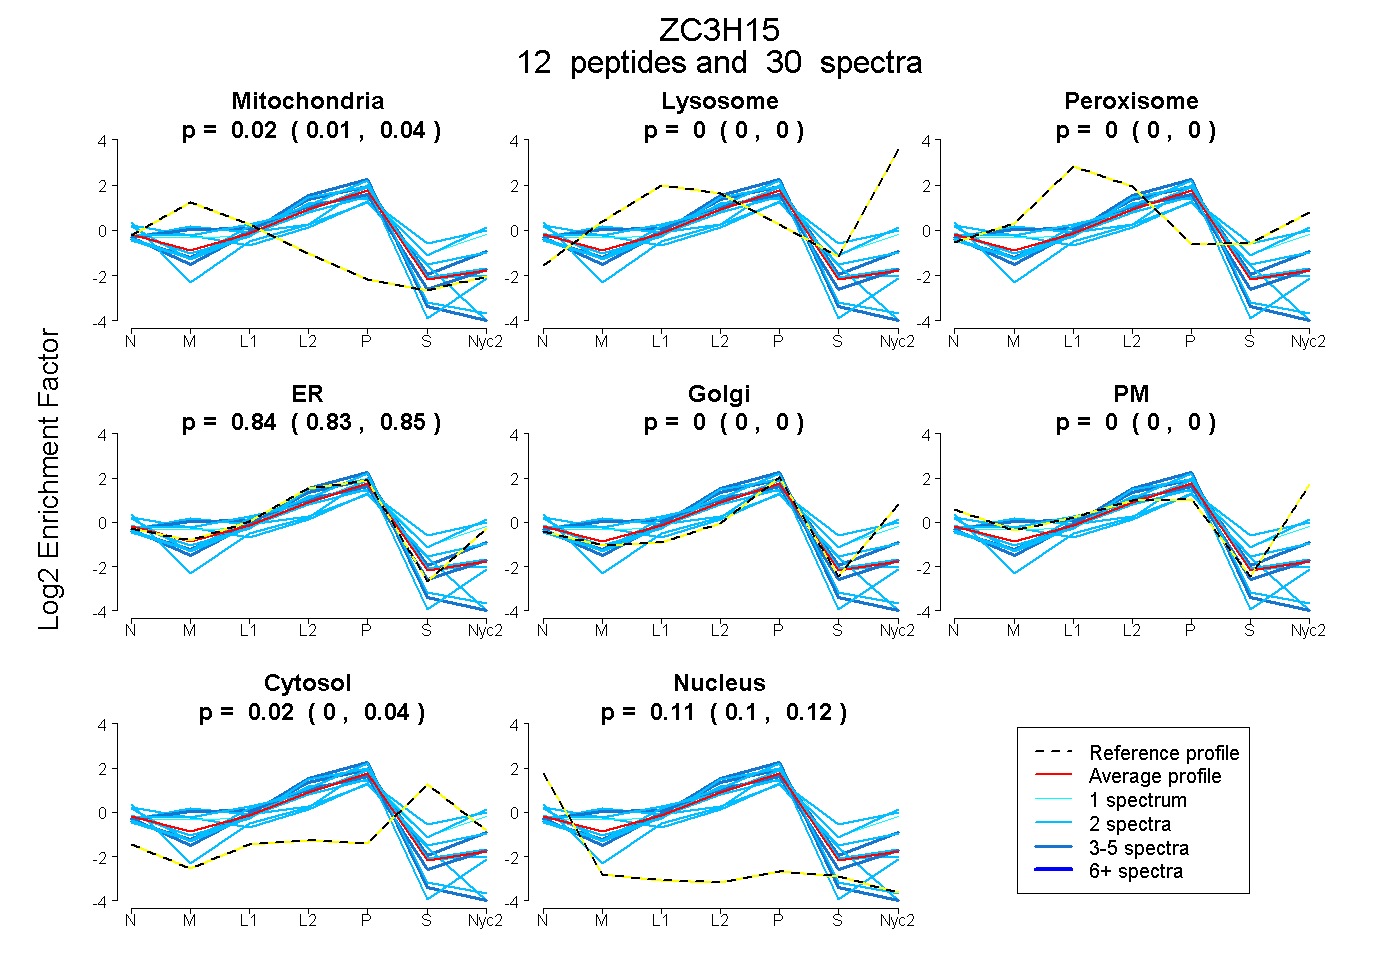
0.009 | 0.037
0.000 | 0.000
0.000 | 0.000
0.829 | 0.852
0.000 | 0.000
0.000 | 0.000
0.004 | 0.040
0.097 | 0.124
5peptides
spectra
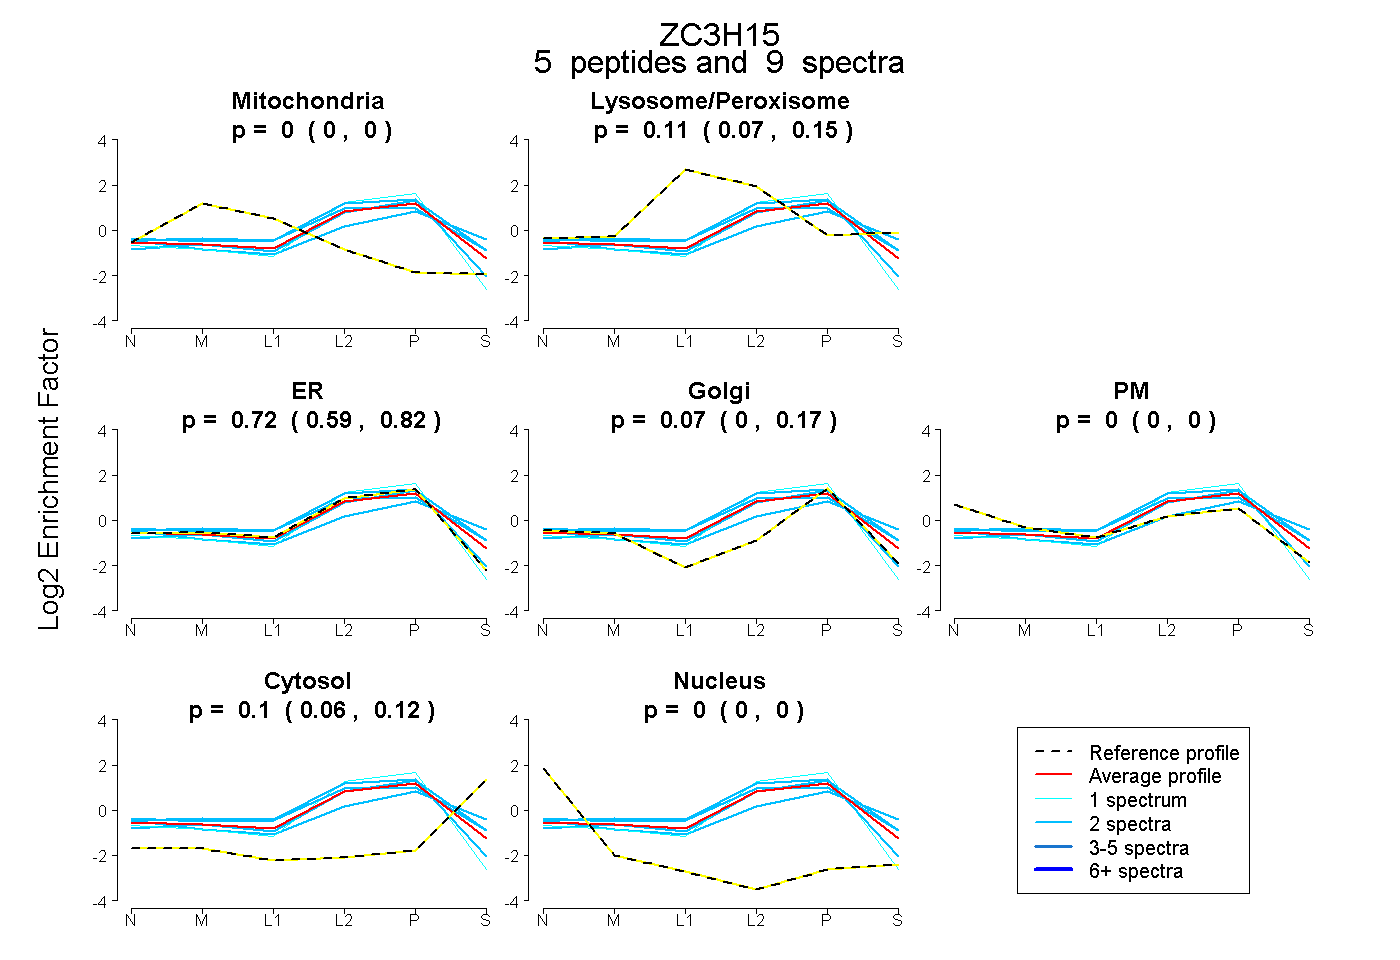
0.000 | 0.000
0.067 | 0.145
0.586 | 0.818
0.000 | 0.167
0.000 | 0.000
0.064 | 0.122
0.000 | 0.000
11peptides
spectra
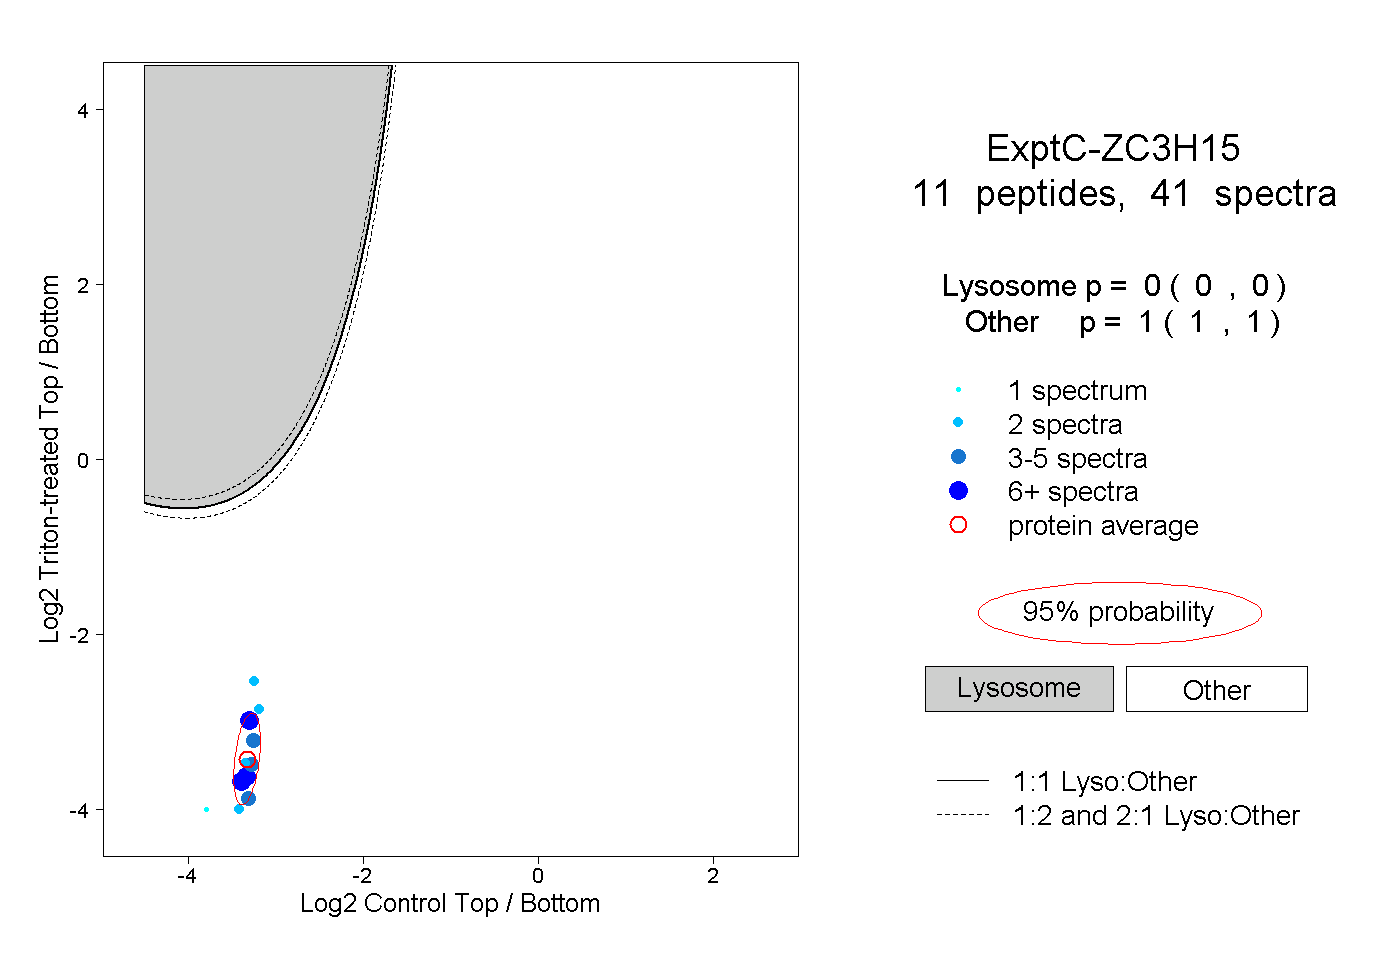
0.000 | 0.000
1.000 | 1.000
4peptides
spectra
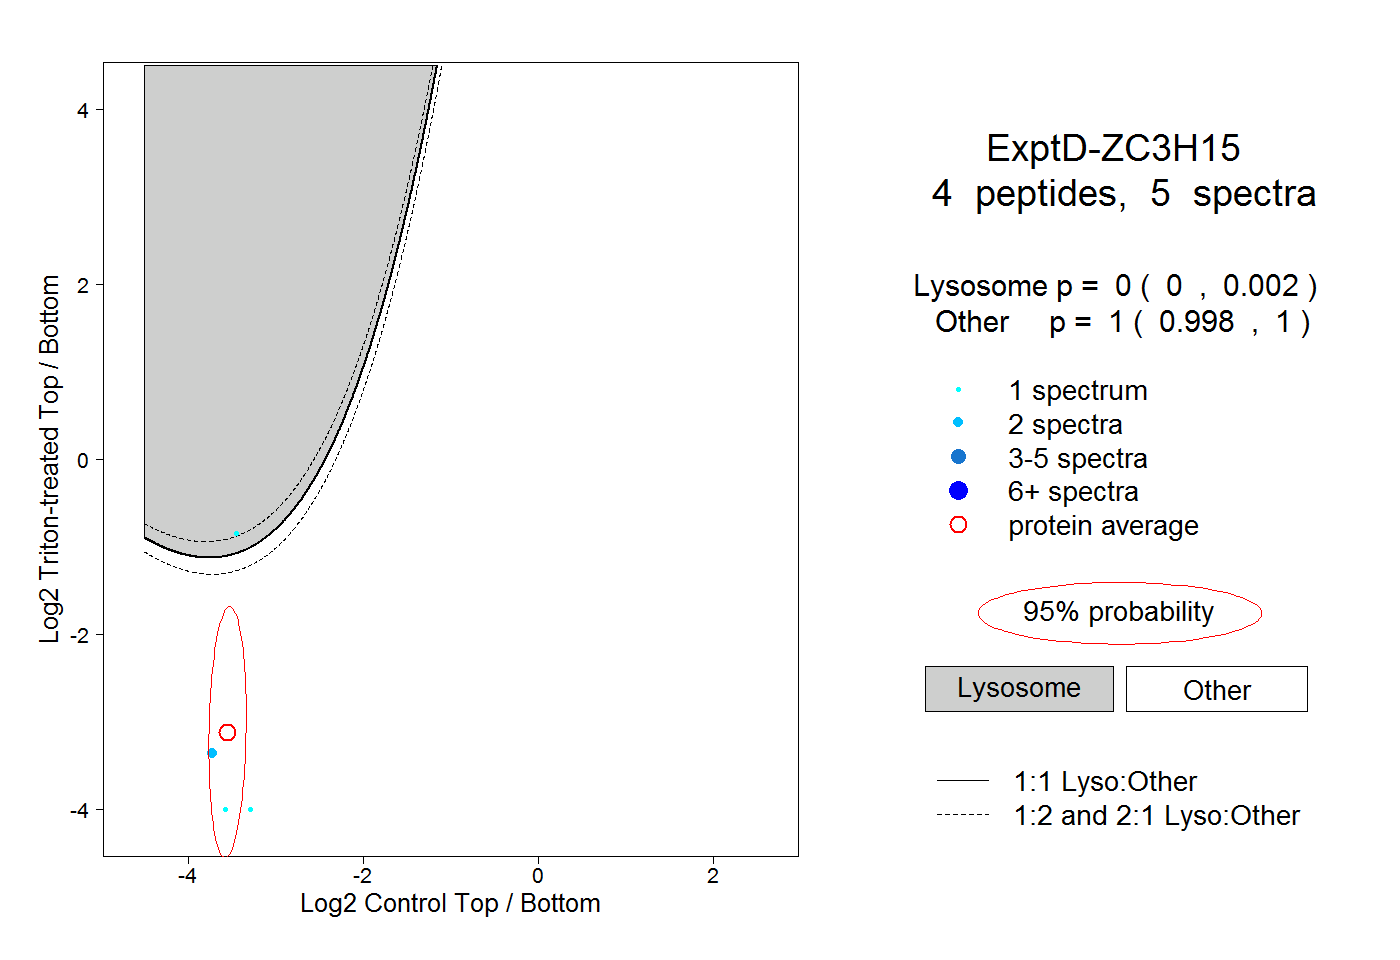
0.000 | 0.002
0.998 | 1.000