 12
12peptides
spectra
0.009 | 0.037
0.000 | 0.000
0.000 | 0.000
0.829 | 0.852
0.000 | 0.000
0.000 | 0.000
0.004 | 0.040
0.097 | 0.124
| Plot | Mito | Lyso | Perox | ER | Golgi | PM | Cytosol | Nucleus | |||||
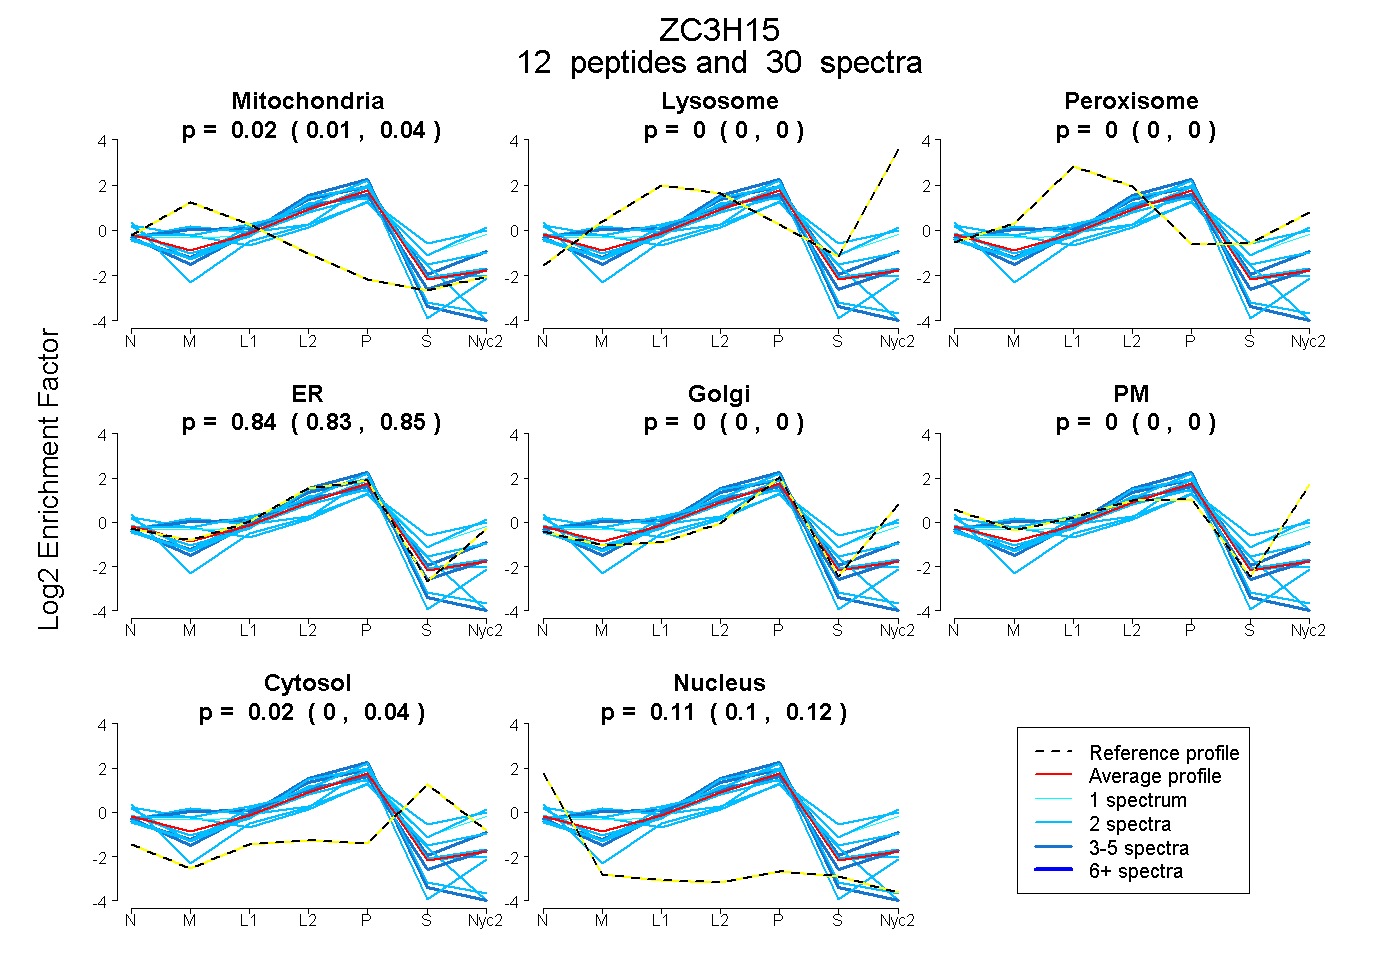
| Expt A |
12 peptides |
30 spectra |
|
0.024 0.009 | 0.037 |
0.000 0.000 | 0.000 |
0.000 0.000 | 0.000 |
0.841 0.829 | 0.852 |
0.000 0.000 | 0.000 |
0.000 0.000 | 0.000 |
0.023 0.004 | 0.040 |
0.111 0.097 | 0.124 |
| 2 spectra, QGQCTK | 0.000 | 0.063 | 0.026 | 0.516 | 0.176 | 0.000 | 0.219 | 0.000 | ||
| 2 spectra, HFLEAIENNK | 0.000 | 0.000 | 0.055 | 0.547 | 0.000 | 0.138 | 0.260 | 0.000 | ||
| 5 spectra, SALGPNVTK | 0.223 | 0.000 | 0.000 | 0.777 | 0.000 | 0.000 | 0.000 | 0.000 | ||
| 2 spectra, DVEETGITVASLER | 0.348 | 0.000 | 0.000 | 0.526 | 0.000 | 0.000 | 0.011 | 0.115 | ||
| 1 spectrum, HALPPGFVLK | 0.000 | 0.000 | 0.119 | 0.550 | 0.177 | 0.000 | 0.154 | 0.000 | ||
| 2 spectra, DTMDNWDEK | 0.155 | 0.000 | 0.000 | 0.474 | 0.212 | 0.000 | 0.111 | 0.047 | ||
| 2 spectra, SVVCAFFK | 0.000 | 0.000 | 0.000 | 0.824 | 0.000 | 0.000 | 0.000 | 0.176 | ||
| 5 spectra, EVFEFRPELVNDDDEEADDTR | 0.000 | 0.000 | 0.000 | 0.820 | 0.000 | 0.000 | 0.000 | 0.180 | ||
| 2 spectra, HGEAEK | 0.000 | 0.000 | 0.000 | 0.891 | 0.000 | 0.000 | 0.006 | 0.103 | ||
| 2 spectra, SVYIDAR | 0.163 | 0.000 | 0.000 | 0.797 | 0.000 | 0.000 | 0.000 | 0.040 | ||
| 2 spectra, LSEASGGLAENGER | 0.000 | 0.000 | 0.000 | 0.744 | 0.000 | 0.000 | 0.052 | 0.204 | ||
| 3 spectra, ALVISGR | 0.000 | 0.000 | 0.000 | 0.885 | 0.000 | 0.000 | 0.115 | 0.000 |
| Plot | Mito | Lyso or Perox | ER | Golgi | PM | Cytosol | Nucleus | ||||||
| Expt B |
5 peptides |
9 spectra |
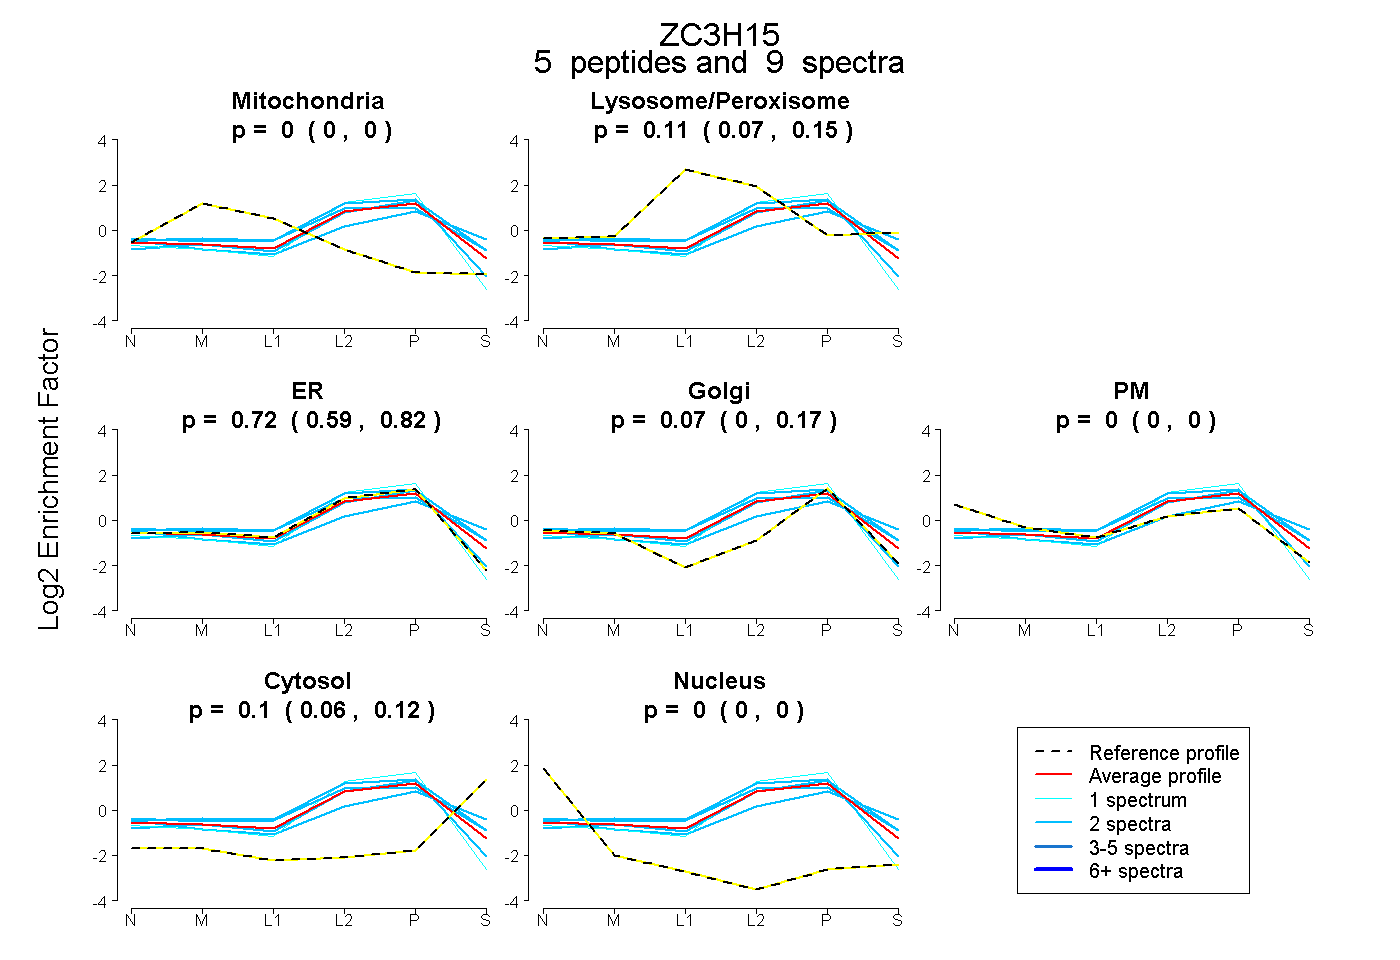 |
0.000 0.000 | 0.000 |
0.107 0.067 | 0.145 |
0.723 0.586 | 0.818 |
0.072 0.000 | 0.167 |
0.000 0.000 | 0.000 |
0.098 0.064 | 0.122 |
0.000 0.000 | 0.000 |
|||
| Plot | Lyso | Other | |||||||||||
| Expt C |
11 peptides |
41 spectra |
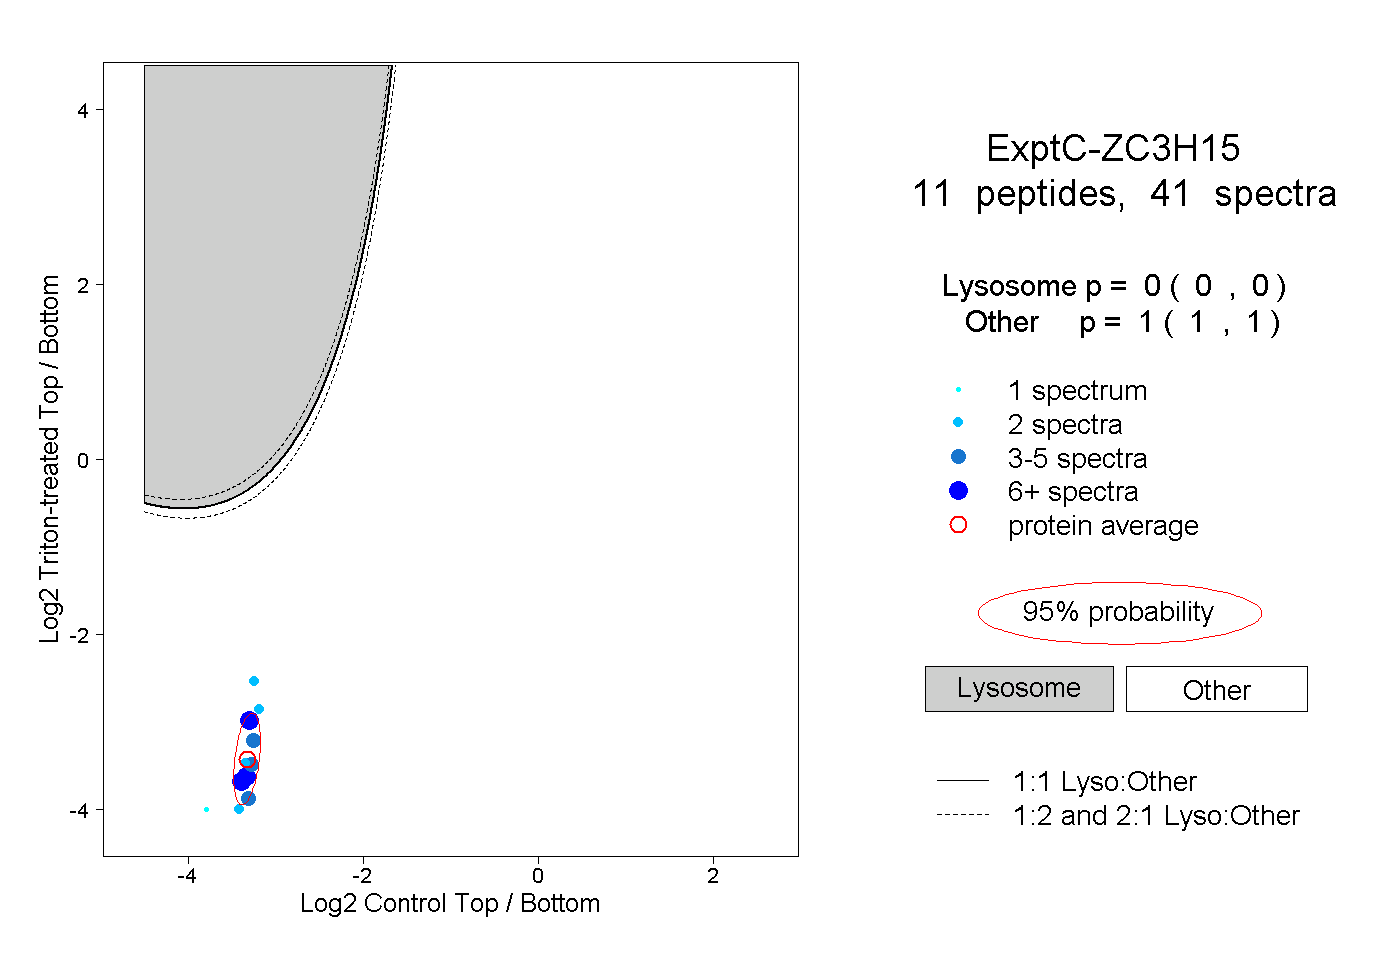 |
0.000 0.000 | 0.000 |
1.000 1.000 | 1.000 |
||||||||
| Plot | Lyso | Other | |||||||||||
| Expt D |
4 peptides |
5 spectra |
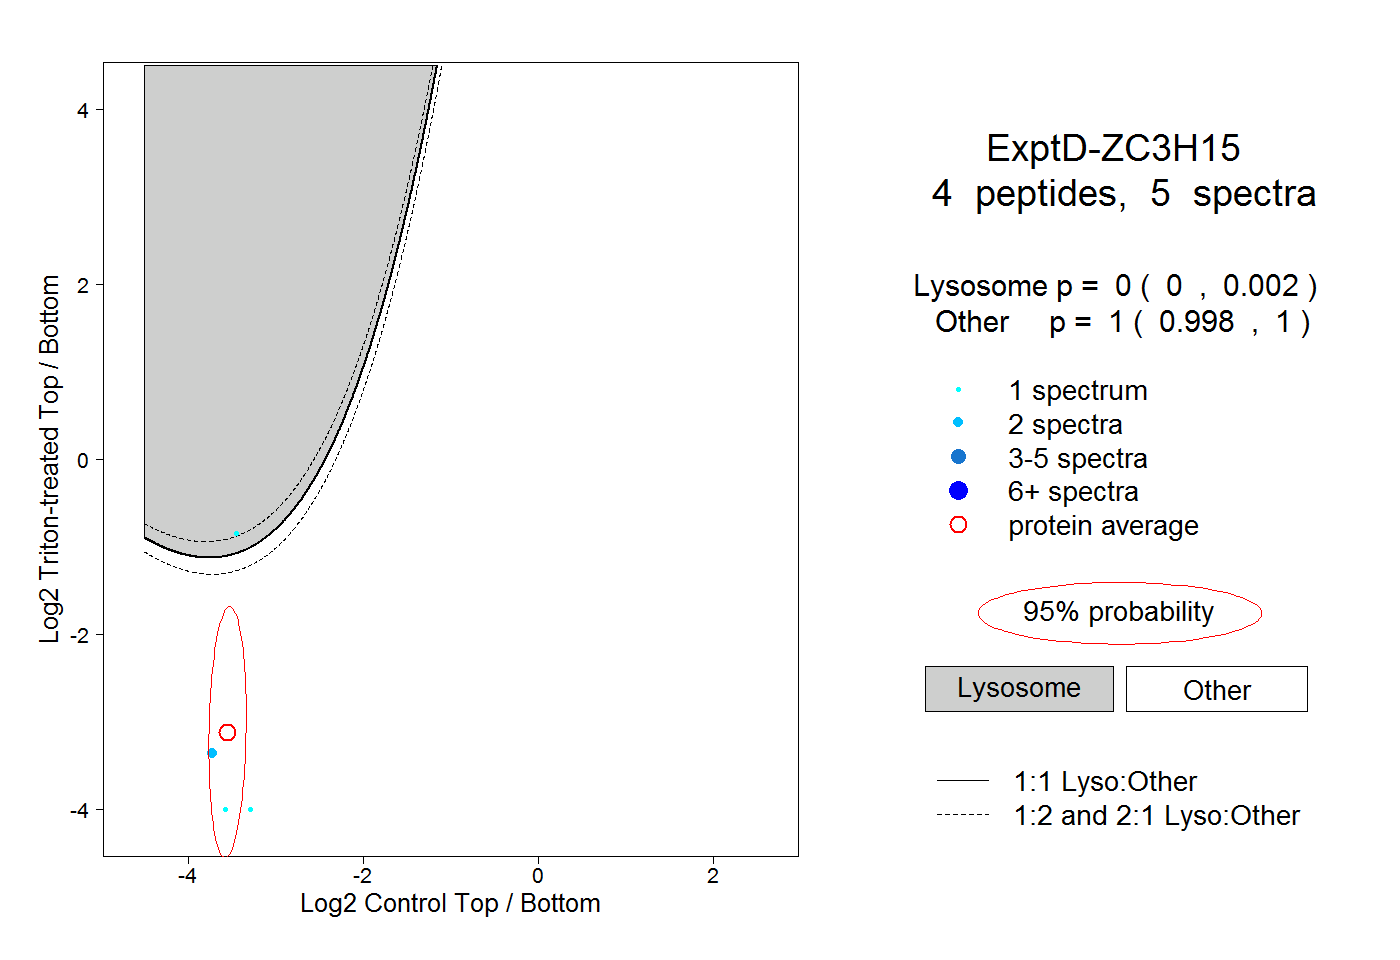 |
0.000 0.000 | 0.002 |
1.000 0.998 | 1.000 |