 7
7peptides
spectra
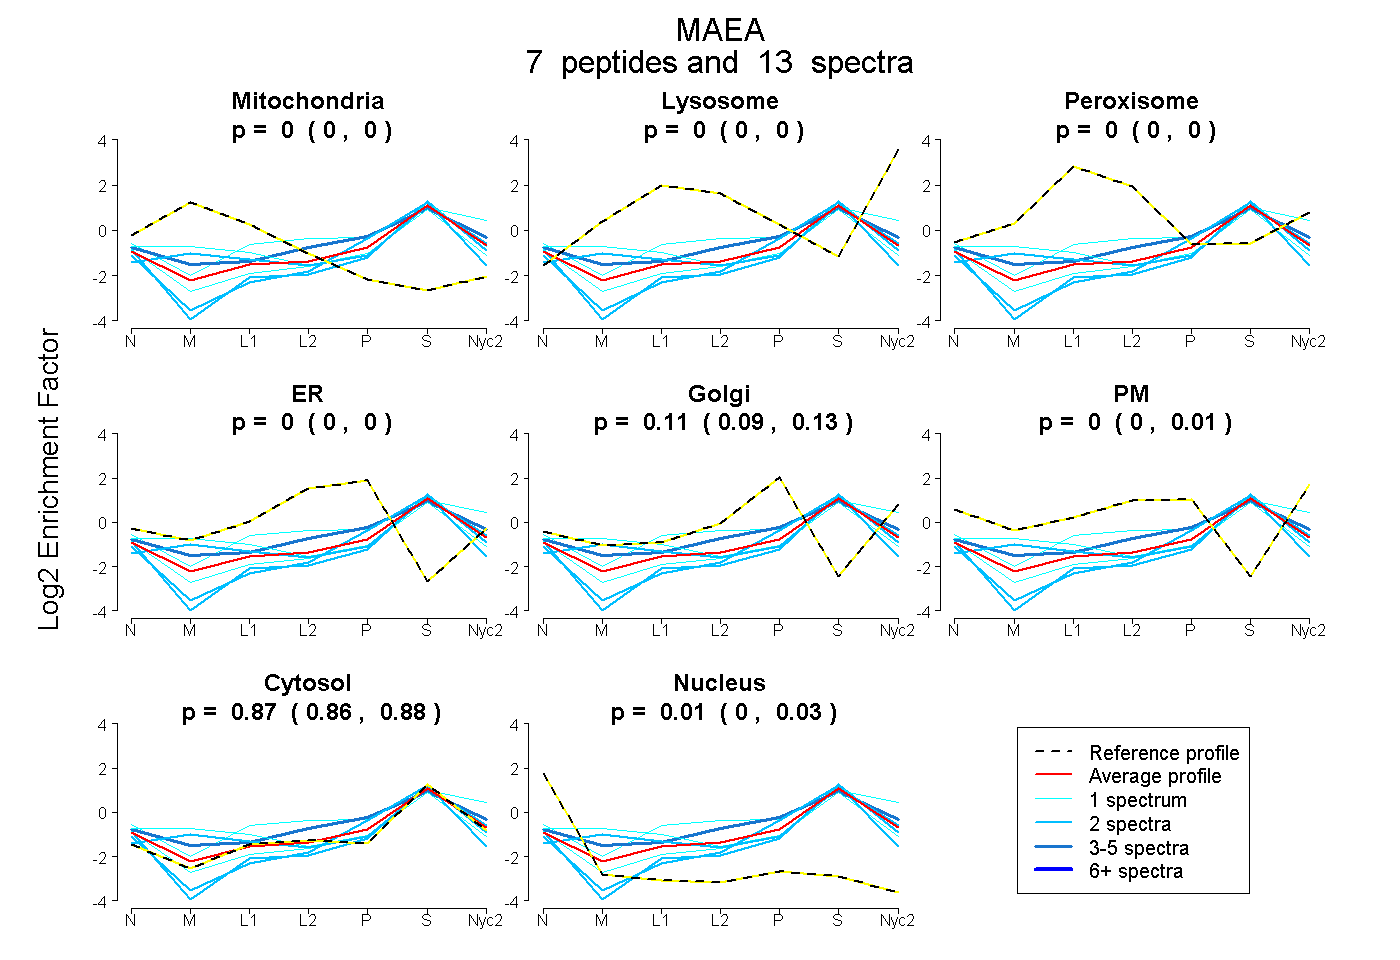
0.000 | 0.001
0.000 | 0.000
0.000 | 0.000
0.000 | 0.000
0.093 | 0.128
0.000 | 0.009
0.858 | 0.884
0.000 | 0.025
2peptides
spectra
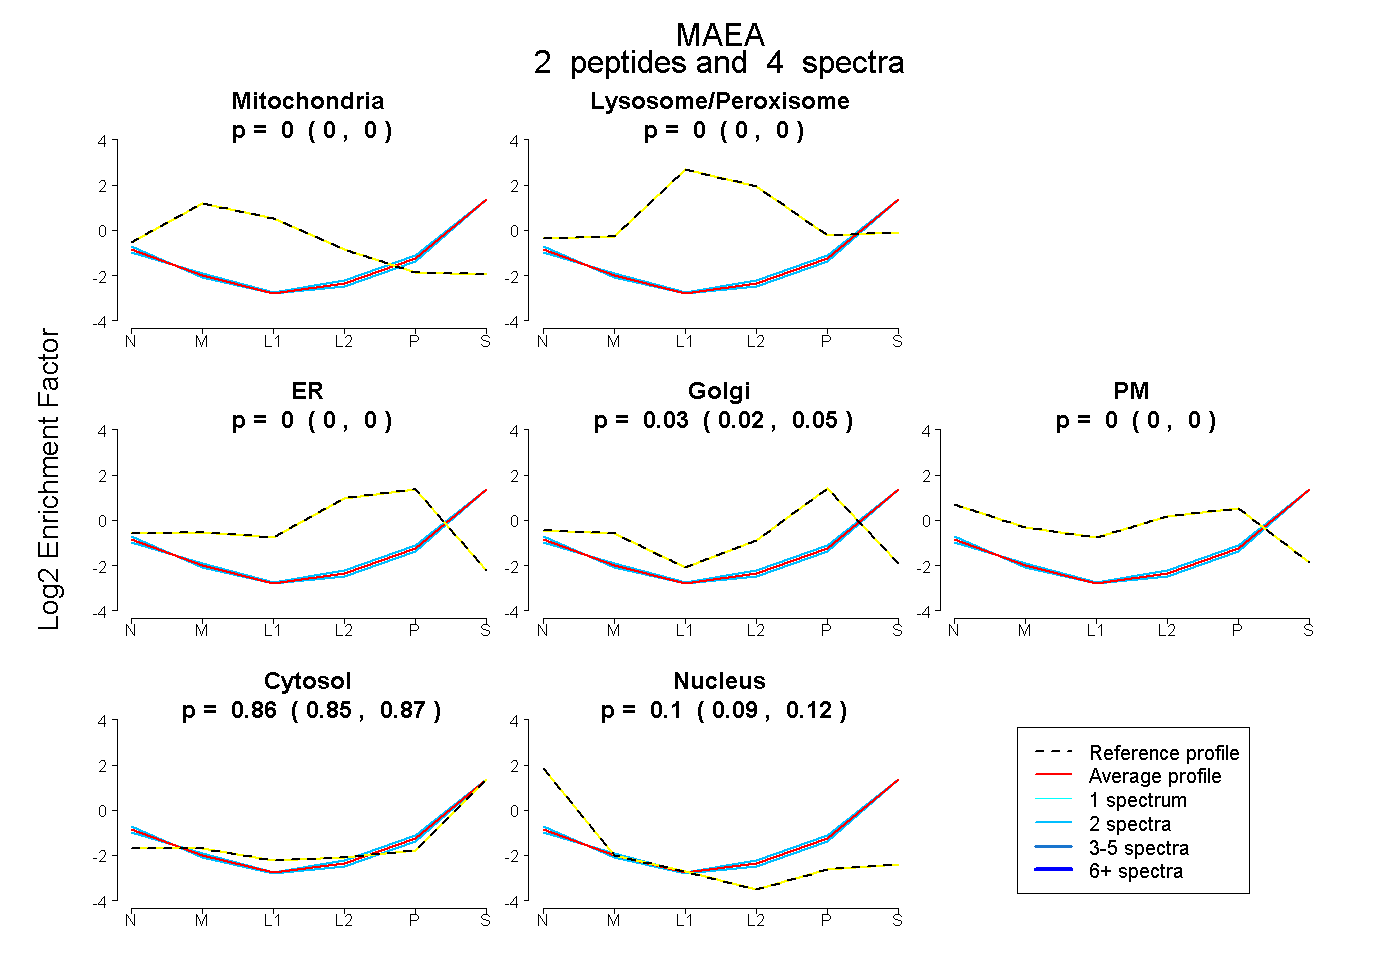
0.000 | 0.000
0.000 | 0.000
0.000 | 0.000
0.017 | 0.046
0.000 | 0.000
0.853 | 0.874
0.087 | 0.115