 28
28peptides
spectra
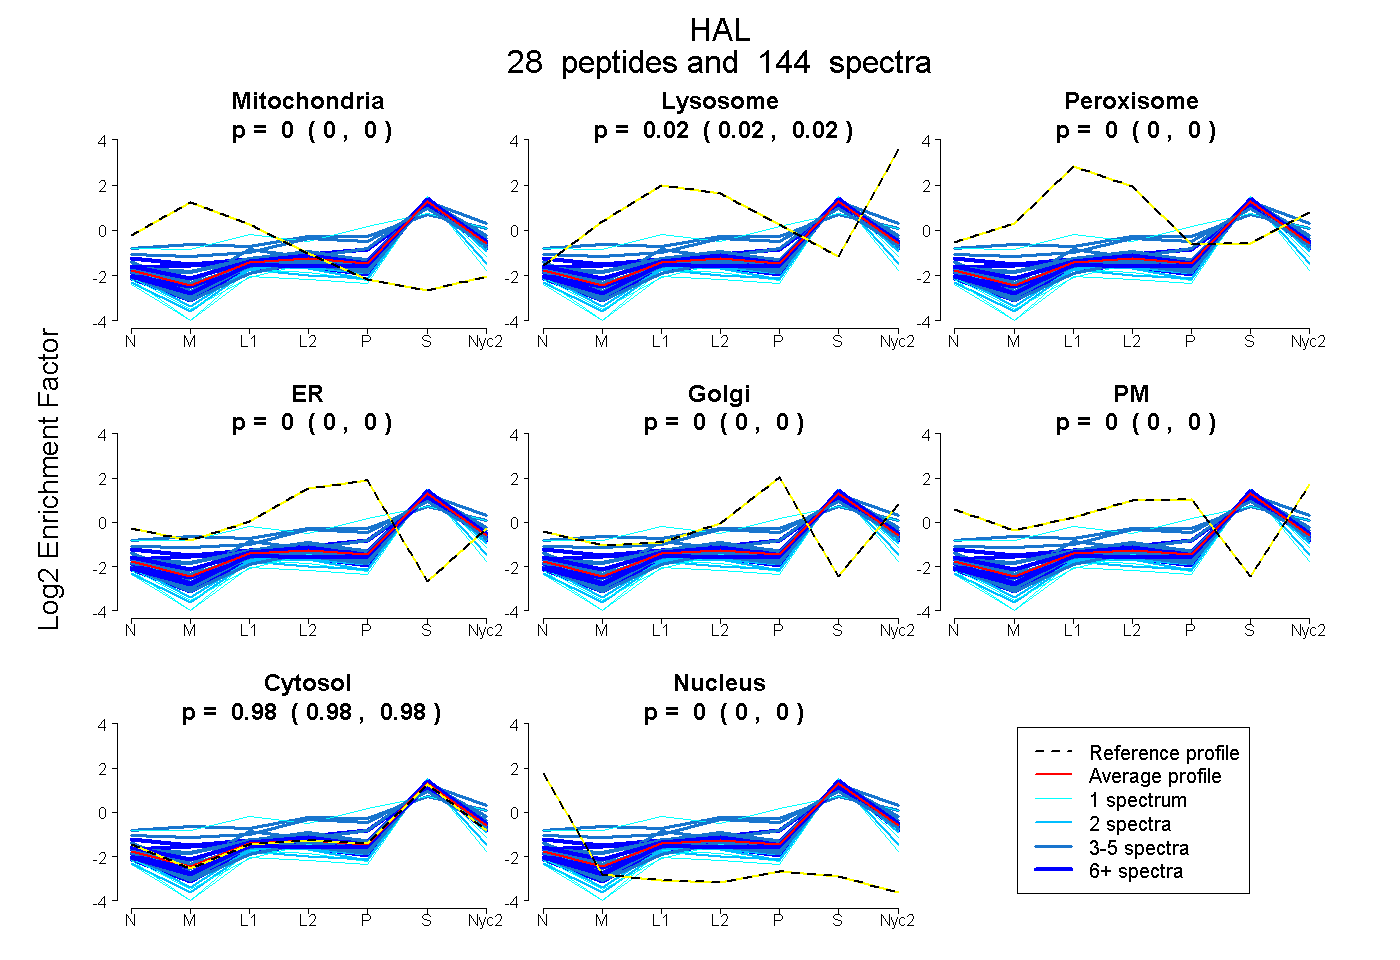
0.000 | 0.000
0.021 | 0.024
0.000 | 0.000
0.000 | 0.000
0.000 | 0.000
0.000 | 0.000
0.975 | 0.979
0.000 | 0.000
20peptides
spectra
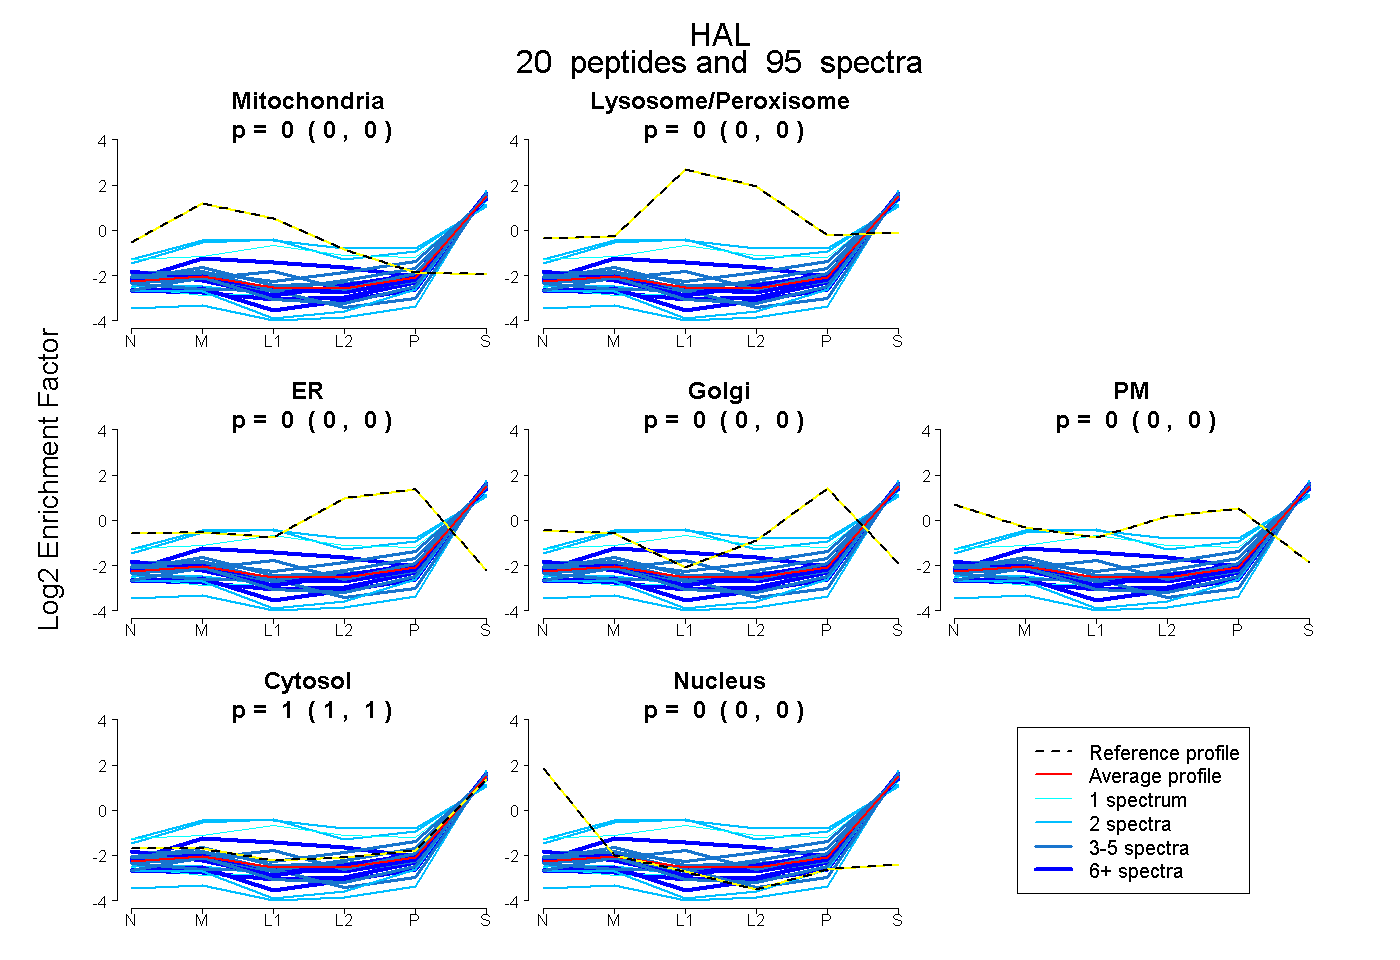
0.000 | 0.000
0.000 | 0.000
0.000 | 0.000
0.000 | 0.000
0.000 | 0.000
1.000 | 1.000
0.000 | 0.000
30peptides
spectra
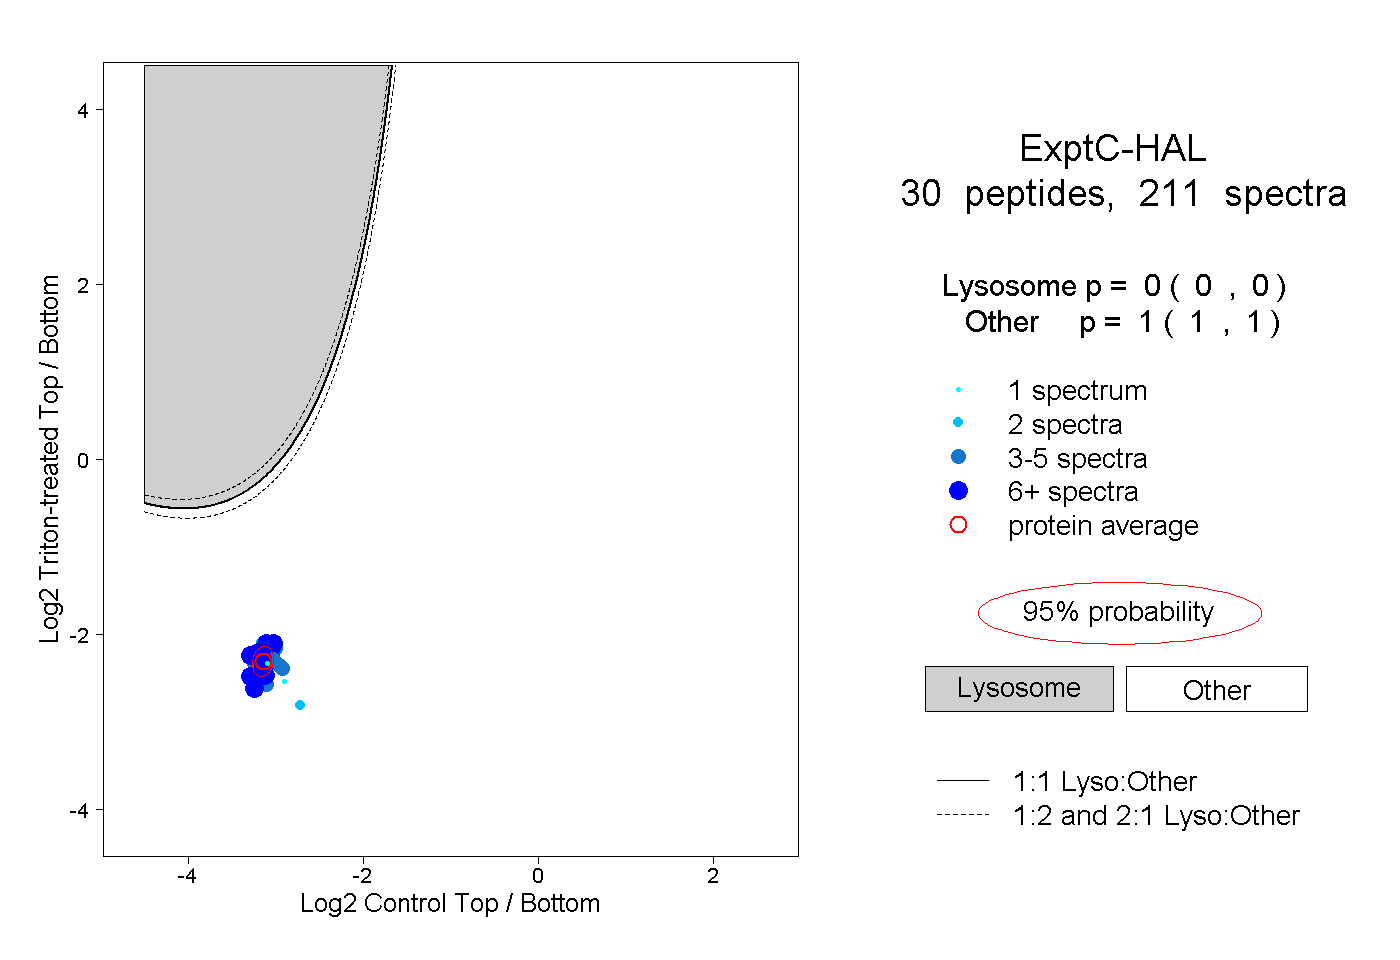
0.000 | 0.000
1.000 | 1.000
6peptides
spectra
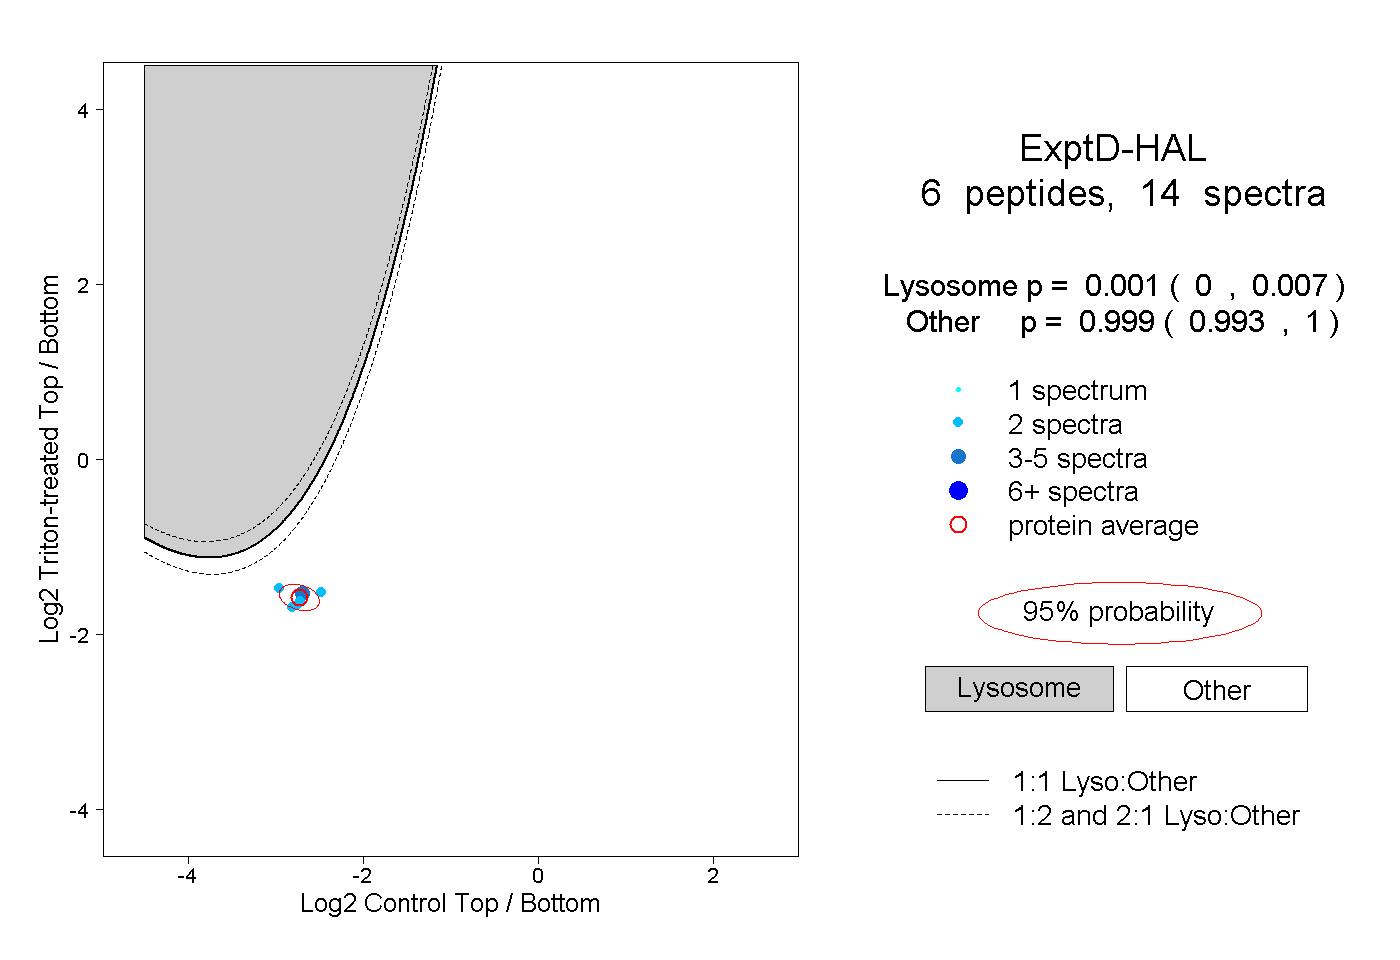
0.000 | 0.007
0.993 | 1.000