 28
28peptides
spectra
0.000 | 0.000
0.021 | 0.024
0.000 | 0.000
0.000 | 0.000
0.000 | 0.000
0.000 | 0.000
0.975 | 0.979
0.000 | 0.000
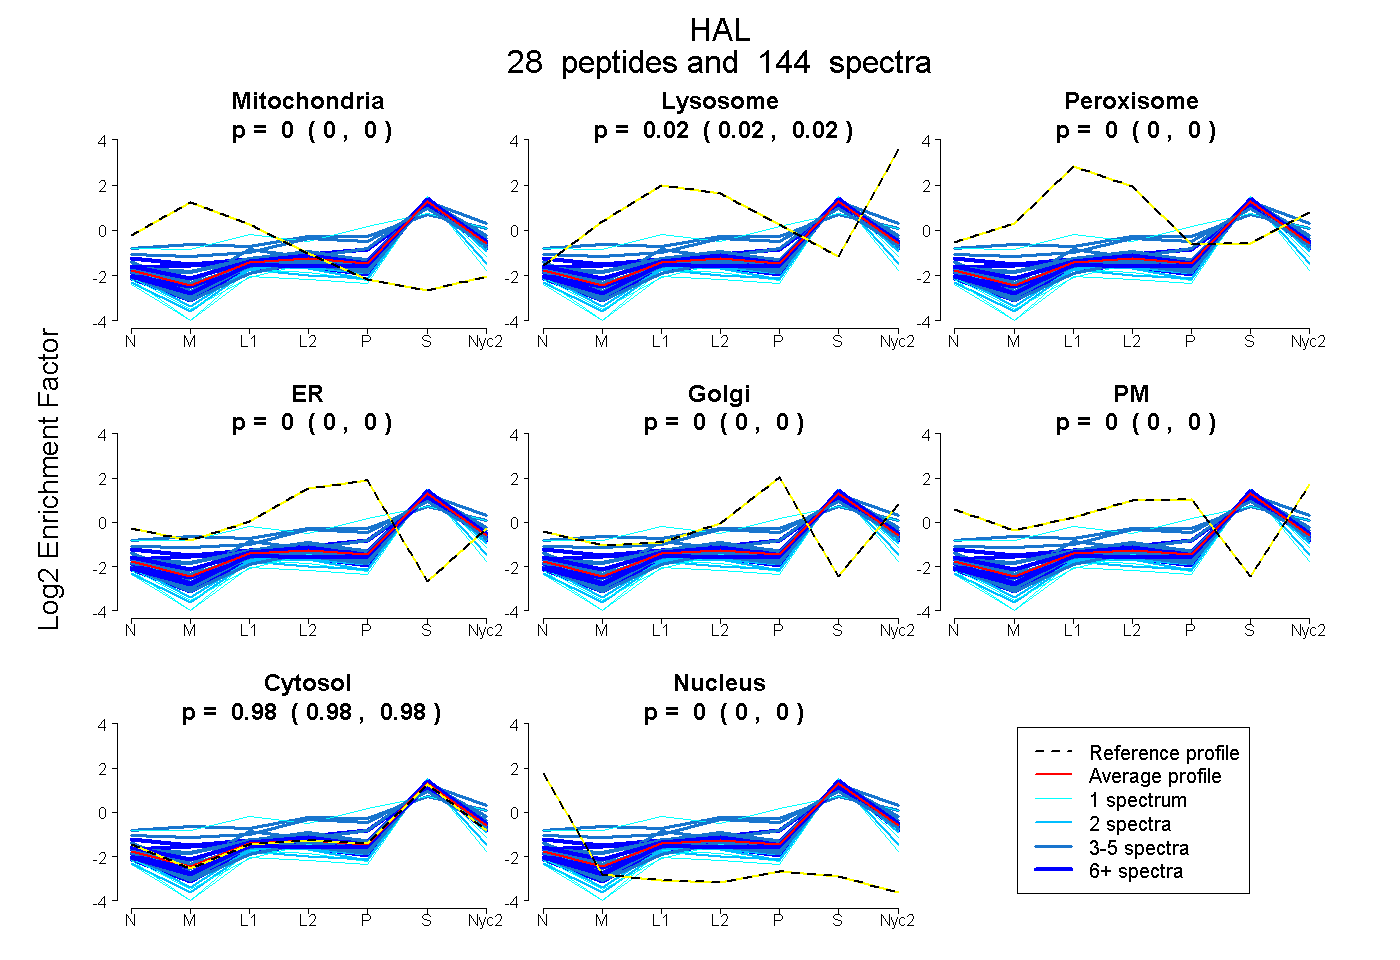
| Plot | Mito | Lyso | Perox | ER | Golgi | PM | Cytosol | Nucleus | |||||
| Expt A |
28 peptides |
144 spectra |
|
0.000 0.000 | 0.000 |
0.023 0.021 | 0.024 |
0.000 0.000 | 0.000 |
0.000 0.000 | 0.000 |
0.000 0.000 | 0.000 |
0.000 0.000 | 0.000 |
0.977 0.975 | 0.979 |
0.000 0.000 | 0.000 |
| 1 spectrum, DIITTELNSATDNPMVFASR | 0.000 | 0.000 | 0.000 | 0.000 | 0.000 | 0.000 | 1.000 | 0.000 | ||
| 1 spectrum, MEHIPESRPLSPTAFSLESLR | 0.000 | 0.000 | 0.000 | 0.000 | 0.000 | 0.000 | 0.915 | 0.085 | ||
| 13 spectra, ALDYLAIGVHELAAISER | 0.000 | 0.000 | 0.000 | 0.000 | 0.000 | 0.000 | 1.000 | 0.000 | ||
| 4 spectra, YTVHVR | 0.006 | 0.000 | 0.146 | 0.110 | 0.034 | 0.000 | 0.704 | 0.000 | ||
| 3 spectra, ASAIAR | 0.000 | 0.048 | 0.000 | 0.000 | 0.000 | 0.000 | 0.952 | 0.000 | ||
| 3 spectra, AFDTDIHAVRPHR | 0.022 | 0.095 | 0.139 | 0.000 | 0.107 | 0.066 | 0.571 | 0.000 | ||
| 4 spectra, GETISGGNFHGEYPAK | 0.000 | 0.000 | 0.000 | 0.000 | 0.000 | 0.000 | 1.000 | 0.000 | ||
| 4 spectra, QADIVAALTLEVLK | 0.000 | 0.079 | 0.000 | 0.000 | 0.000 | 0.000 | 0.921 | 0.000 | ||
| 7 spectra, VYDLVR | 0.000 | 0.000 | 0.000 | 0.000 | 0.000 | 0.000 | 1.000 | 0.000 | ||
| 5 spectra, LQELQVNLVR | 0.000 | 0.031 | 0.000 | 0.000 | 0.000 | 0.000 | 0.969 | 0.000 | ||
| 12 spectra, FMAPDIEAAHR | 0.050 | 0.070 | 0.000 | 0.000 | 0.064 | 0.000 | 0.816 | 0.000 | ||
| 1 spectrum, GTVGASGDLAPLSHLALGLIGEGK | 0.000 | 0.059 | 0.221 | 0.000 | 0.202 | 0.000 | 0.518 | 0.000 | ||
| 8 spectra, VWEVAAPYIEK | 0.000 | 0.057 | 0.000 | 0.000 | 0.000 | 0.000 | 0.943 | 0.000 | ||
| 4 spectra, SGWADAK | 0.000 | 0.037 | 0.000 | 0.000 | 0.000 | 0.000 | 0.963 | 0.000 | ||
| 2 spectra, GQIEVAFR | 0.000 | 0.000 | 0.000 | 0.000 | 0.000 | 0.000 | 1.000 | 0.000 | ||
| 3 spectra, SHSSGVGKPLSPER | 0.000 | 0.092 | 0.000 | 0.000 | 0.026 | 0.000 | 0.882 | 0.000 | ||
| 1 spectrum, TVVYGITTGFGK | 0.000 | 0.000 | 0.000 | 0.000 | 0.000 | 0.000 | 1.000 | 0.000 | ||
| 7 spectra, SVVRPWIK | 0.060 | 0.068 | 0.000 | 0.000 | 0.000 | 0.000 | 0.872 | 0.000 | ||
| 2 spectra, GEWLAVPCQDGK | 0.000 | 0.000 | 0.000 | 0.000 | 0.000 | 0.000 | 0.964 | 0.036 | ||
| 3 spectra, VQDAYTLR | 0.064 | 0.002 | 0.000 | 0.000 | 0.000 | 0.000 | 0.934 | 0.000 | ||
| 3 spectra, TTTPLEK | 0.000 | 0.159 | 0.000 | 0.000 | 0.000 | 0.000 | 0.841 | 0.000 | ||
| 11 spectra, LSVGWLGR | 0.000 | 0.010 | 0.000 | 0.000 | 0.000 | 0.000 | 0.990 | 0.000 | ||
| 1 spectrum, CCPQVHGVVNDTIAFVK | 0.000 | 0.000 | 0.000 | 0.000 | 0.000 | 0.000 | 0.996 | 0.004 | ||
| 2 spectra, GYSGISLETLK | 0.000 | 0.000 | 0.000 | 0.000 | 0.000 | 0.000 | 1.000 | 0.000 | ||
| 4 spectra, TVIPANK | 0.000 | 0.000 | 0.000 | 0.000 | 0.000 | 0.000 | 1.000 | 0.000 | ||
| 23 spectra, MLLALR | 0.000 | 0.000 | 0.000 | 0.000 | 0.000 | 0.000 | 1.000 | 0.000 | ||
| 5 spectra, LLLDQK | 0.000 | 0.001 | 0.000 | 0.000 | 0.000 | 0.000 | 0.999 | 0.000 | ||
| 7 spectra, EVIDSIIK | 0.000 | 0.000 | 0.000 | 0.000 | 0.000 | 0.000 | 1.000 | 0.000 |
| Plot | Mito | Lyso or Perox | ER | Golgi | PM | Cytosol | Nucleus | ||||||
| Expt B |
20 peptides |
95 spectra |
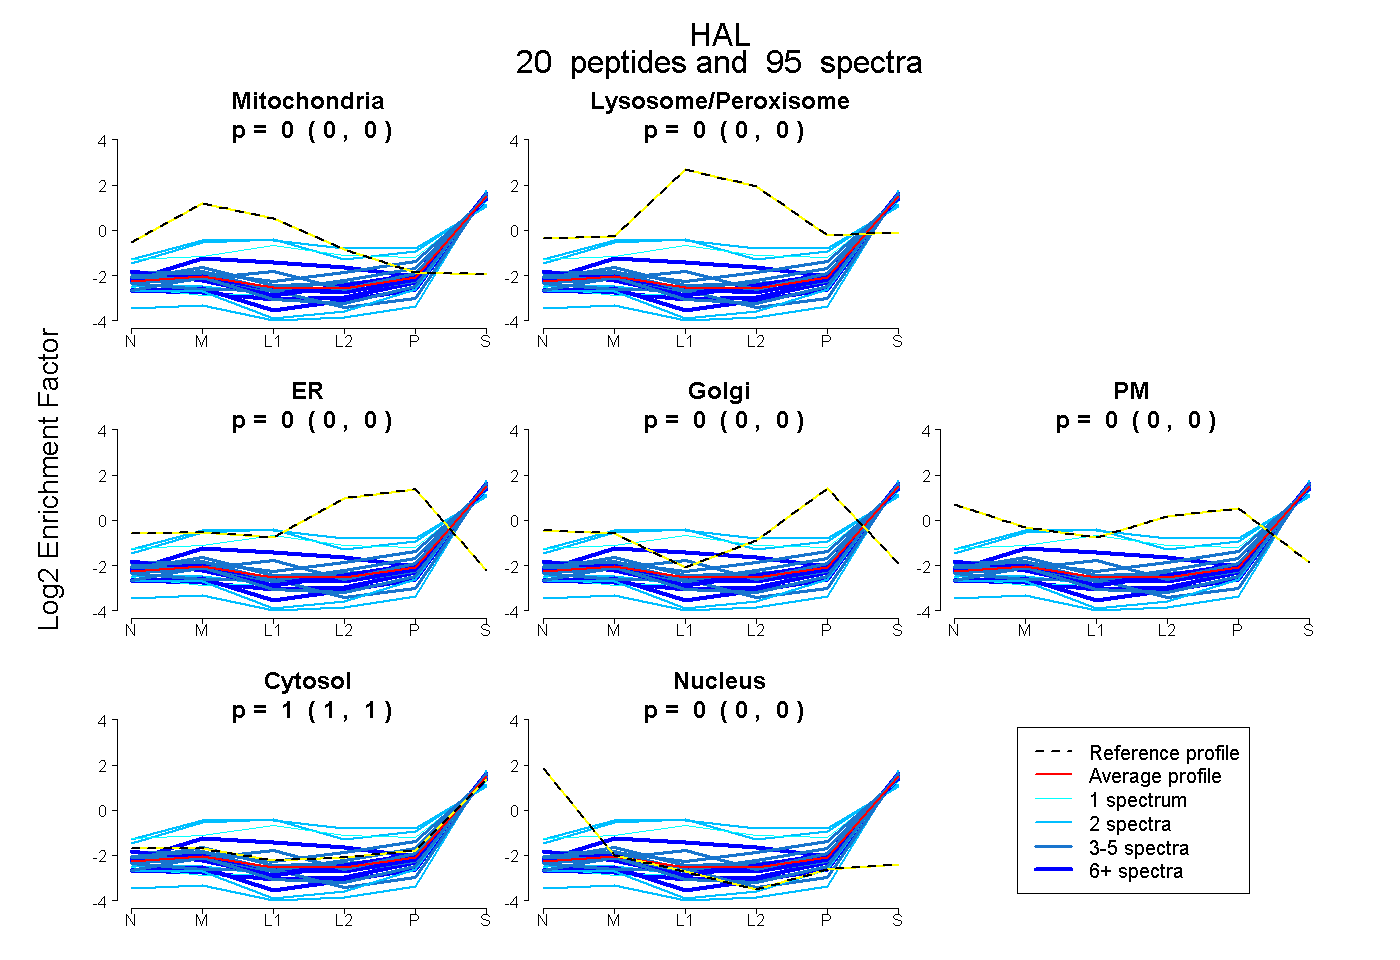 |
0.000 0.000 | 0.000 |
0.000 0.000 | 0.000 |
0.000 0.000 | 0.000 |
0.000 0.000 | 0.000 |
0.000 0.000 | 0.000 |
1.000 1.000 | 1.000 |
0.000 0.000 | 0.000 |
|||
| Plot | Lyso | Other | |||||||||||
| Expt C |
30 peptides |
211 spectra |
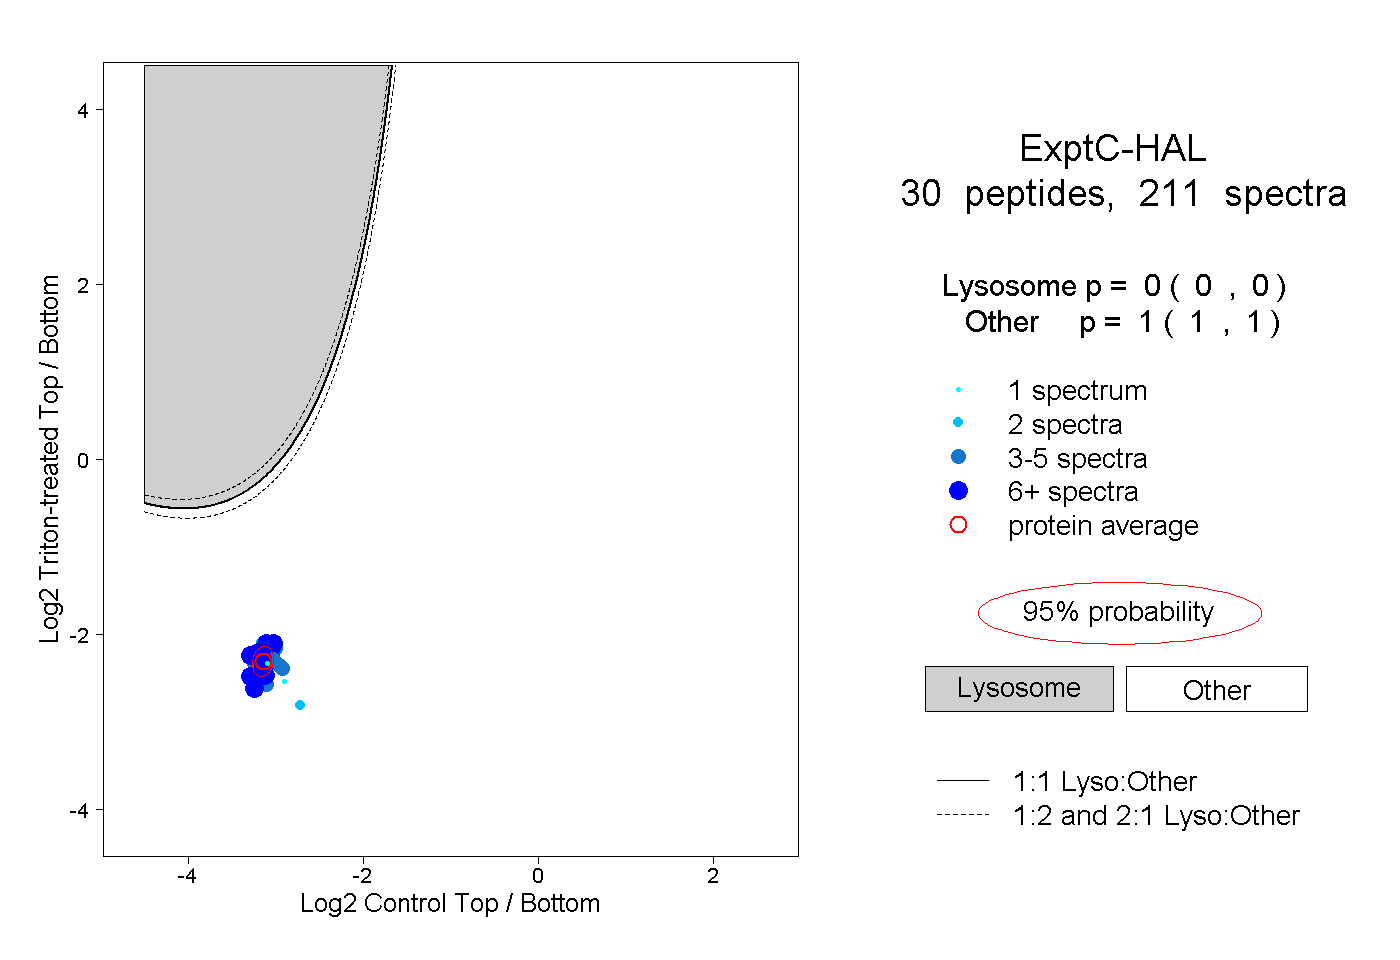 |
0.000 0.000 | 0.000 |
1.000 1.000 | 1.000 |
||||||||
| Plot | Lyso | Other | |||||||||||
| Expt D |
6 peptides |
14 spectra |
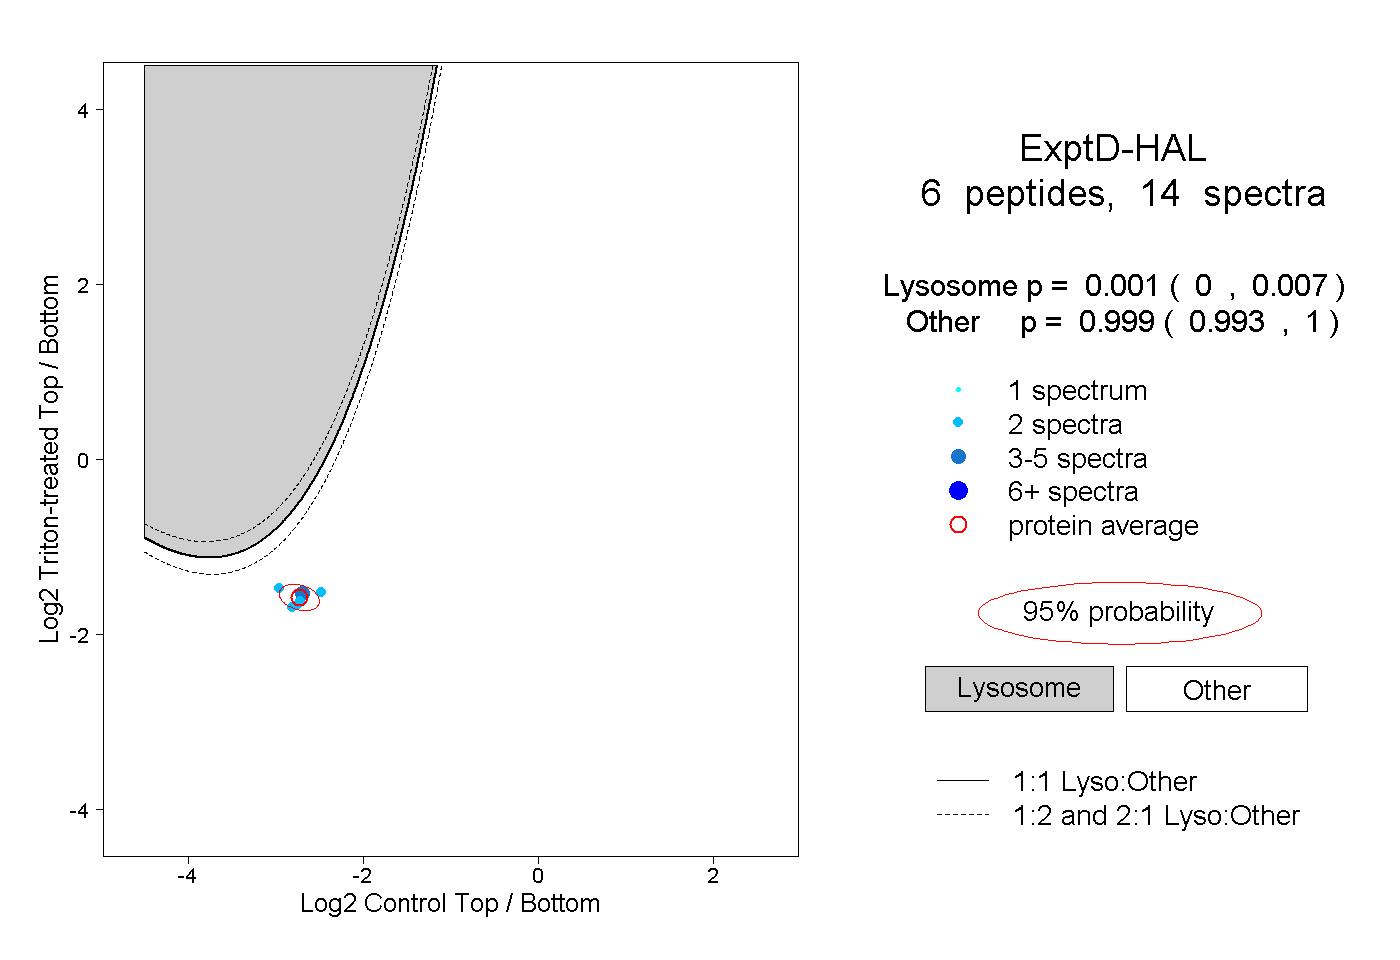 |
0.001 0.000 | 0.007 |
0.999 0.993 | 1.000 |