 7
7peptides
spectra
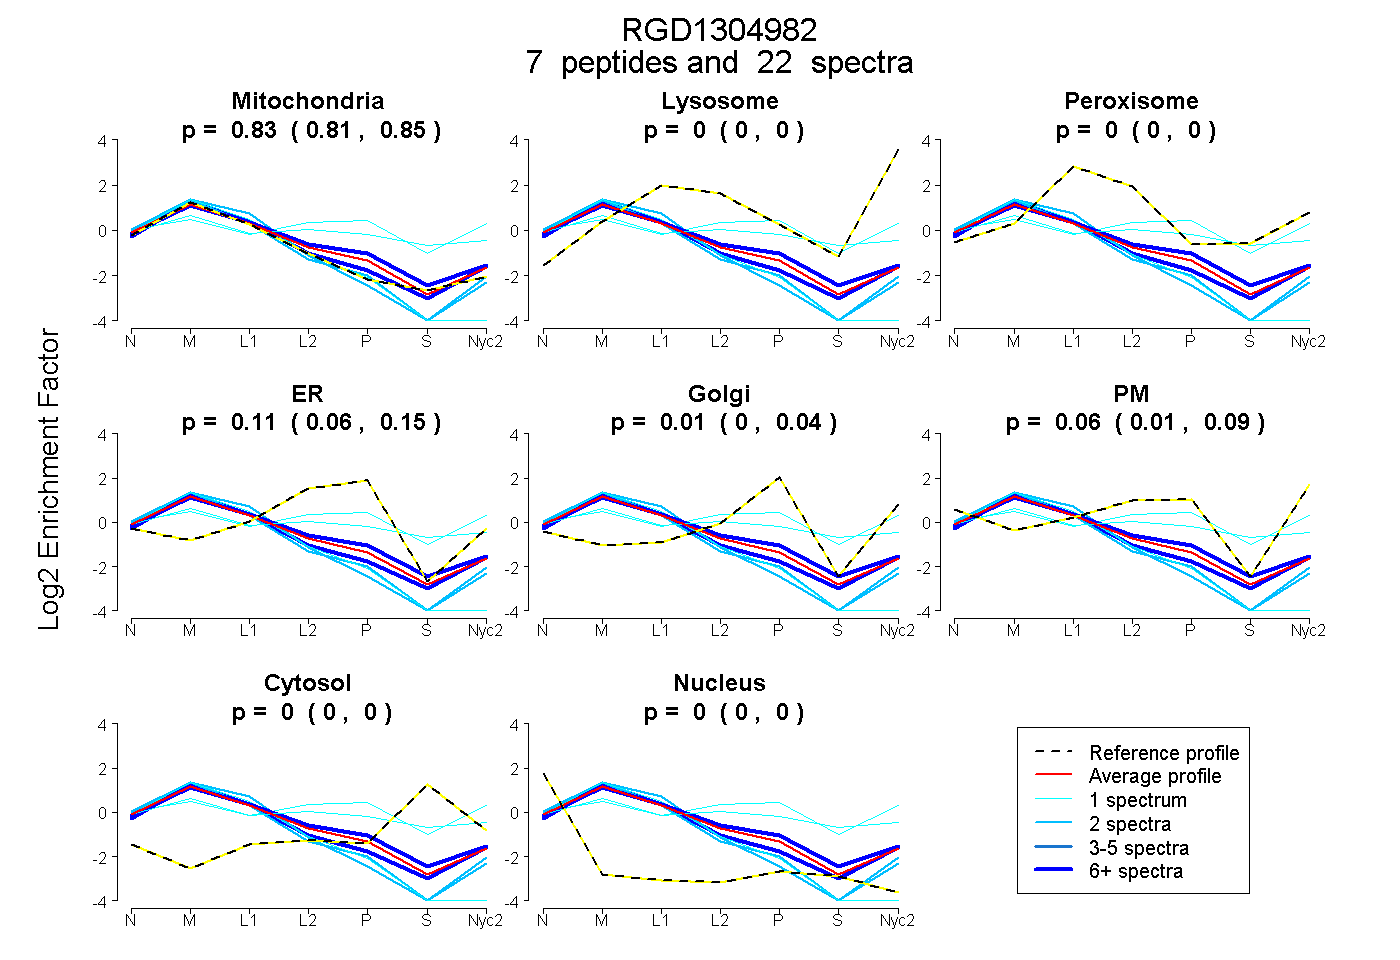
0.808 | 0.849
0.000 | 0.000
0.000 | 0.000
0.055 | 0.145
0.000 | 0.043
0.011 | 0.091
0.000 | 0.000
0.000 | 0.000
7peptides
spectra
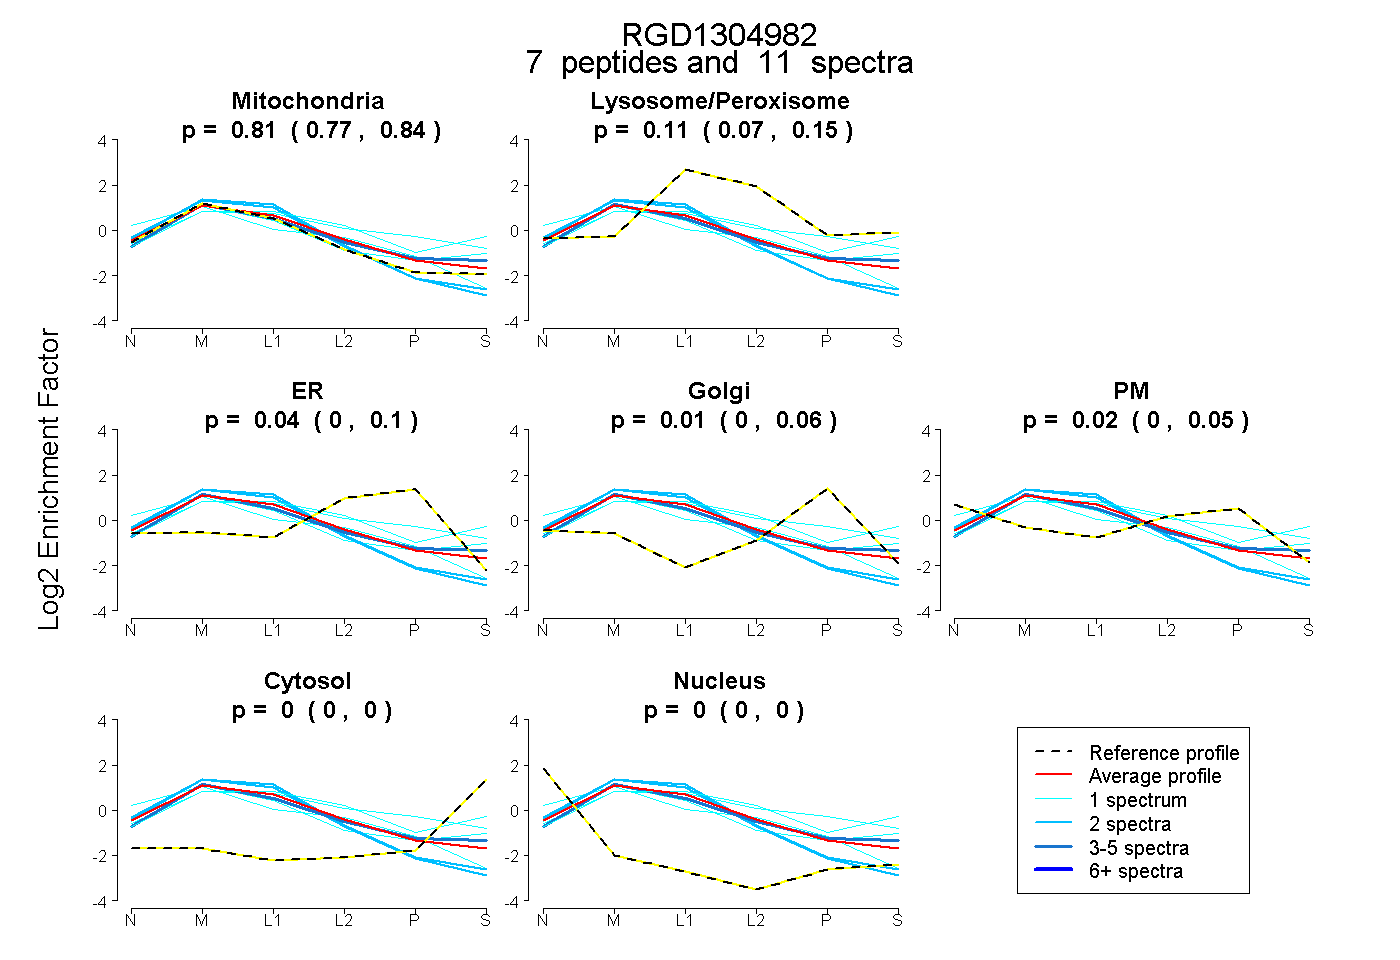
0.769 | 0.841
0.073 | 0.154
0.000 | 0.096
0.000 | 0.064
0.000 | 0.052
0.000 | 0.000
0.000 | 0.000
11peptides
spectra
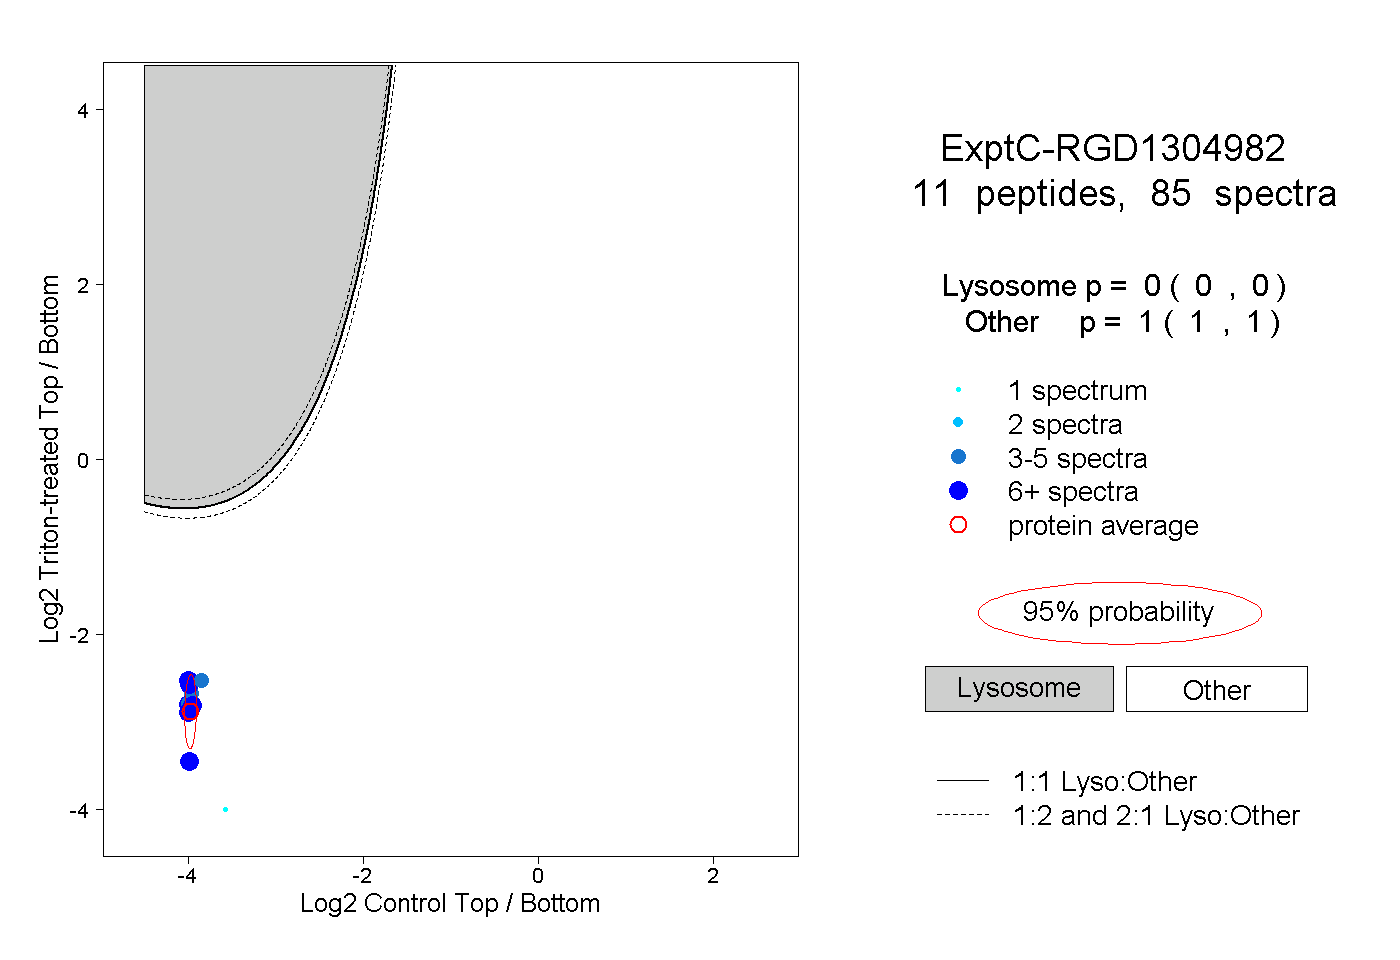
0.000 | 0.000
1.000 | 1.000
5peptides
spectra
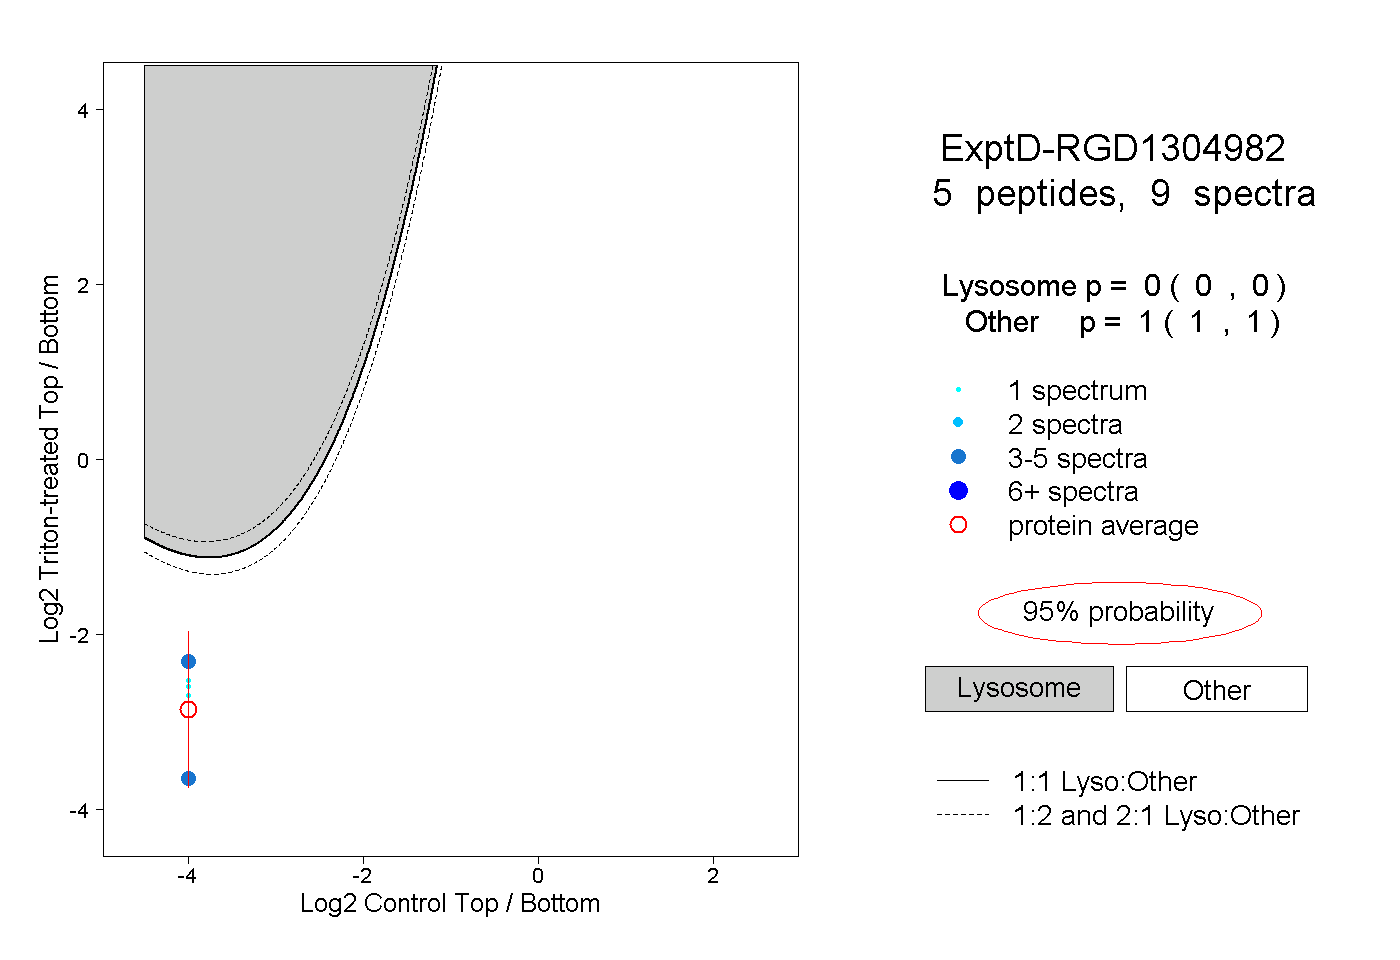
0.000 | 0.000
1.000 | 1.000