 7
7peptides
spectra
0.808 | 0.849
0.000 | 0.000
0.000 | 0.000
0.055 | 0.145
0.000 | 0.043
0.011 | 0.091
0.000 | 0.000
0.000 | 0.000
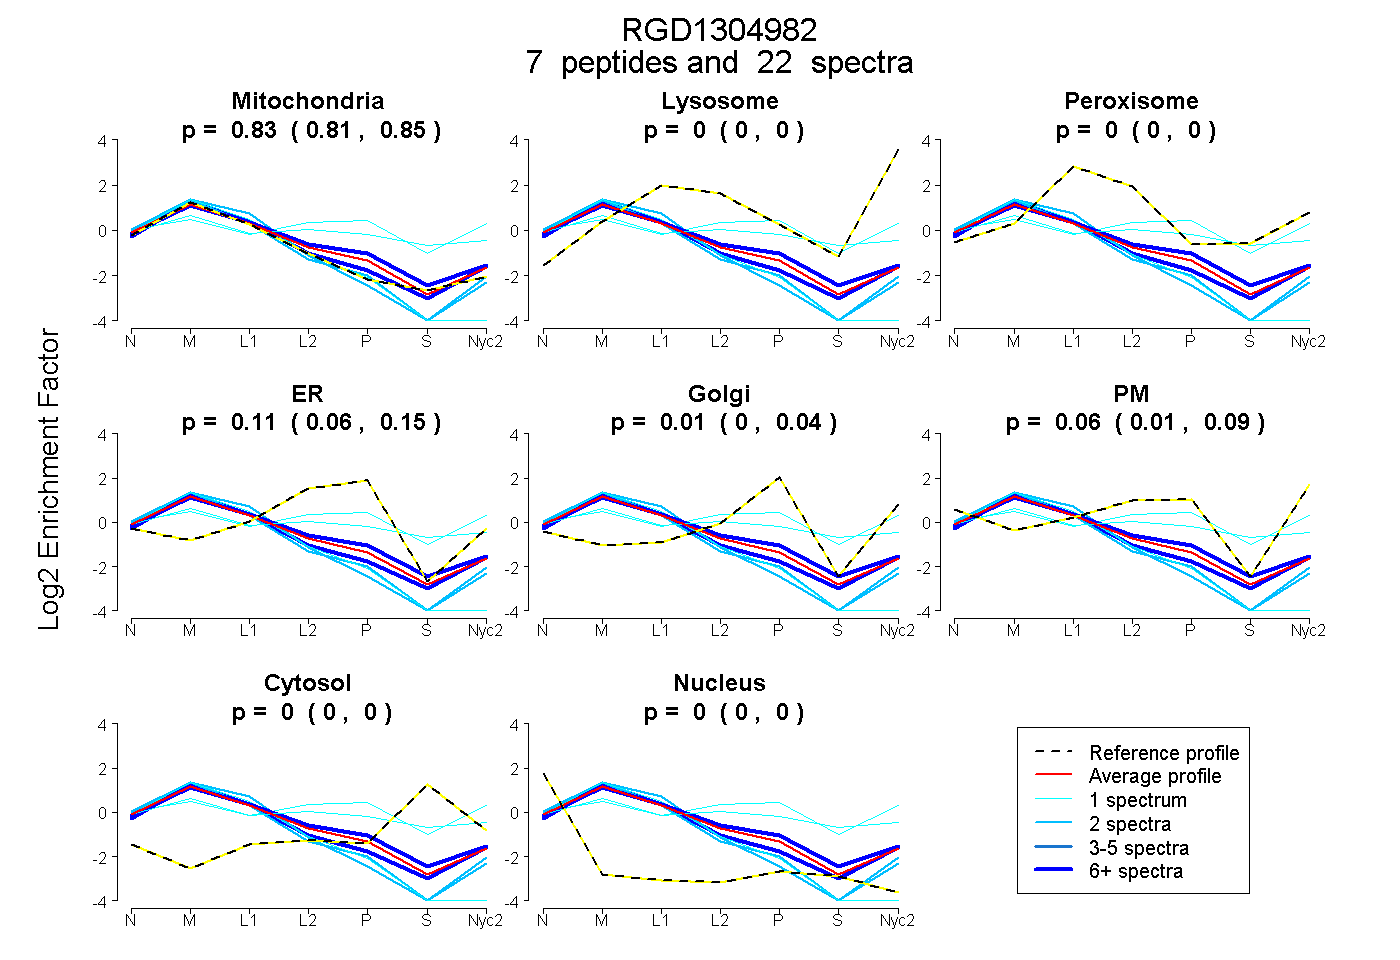
| Plot | Mito | Lyso | Perox | ER | Golgi | PM | Cytosol | Nucleus | |||||
| Expt A |
7 peptides |
22 spectra |
|
0.830 0.808 | 0.849 |
0.000 0.000 | 0.000 |
0.000 0.000 | 0.000 |
0.106 0.055 | 0.145 |
0.007 0.000 | 0.043 |
0.056 0.011 | 0.091 |
0.000 0.000 | 0.000 |
0.000 0.000 | 0.000 |
| 2 spectra, SLAWEGR | 0.977 | 0.000 | 0.000 | 0.000 | 0.000 | 0.000 | 0.000 | 0.023 | ||
| 1 spectrum, YQHQDFAVFSK | 0.315 | 0.000 | 0.213 | 0.000 | 0.173 | 0.113 | 0.187 | 0.000 | ||
| 1 spectrum, GAQSGVNYSQGSLK | 0.181 | 0.000 | 0.177 | 0.000 | 0.213 | 0.305 | 0.124 | 0.000 | ||
| 6 spectra, NISAMGLYWGR | 0.908 | 0.011 | 0.000 | 0.000 | 0.020 | 0.061 | 0.000 | 0.000 | ||
| 9 spectra, VNDAFLHVMQR | 0.758 | 0.000 | 0.042 | 0.126 | 0.060 | 0.014 | 0.000 | 0.000 | ||
| 1 spectrum, VDVHFCGINFADNLVCR | 0.931 | 0.000 | 0.000 | 0.000 | 0.000 | 0.000 | 0.000 | 0.069 | ||
| 2 spectra, QPLTIQEVAPRPIGPQEVR | 1.000 | 0.000 | 0.000 | 0.000 | 0.000 | 0.000 | 0.000 | 0.000 |
| Plot | Mito | Lyso or Perox | ER | Golgi | PM | Cytosol | Nucleus | ||||||
| Expt B |
7 peptides |
11 spectra |
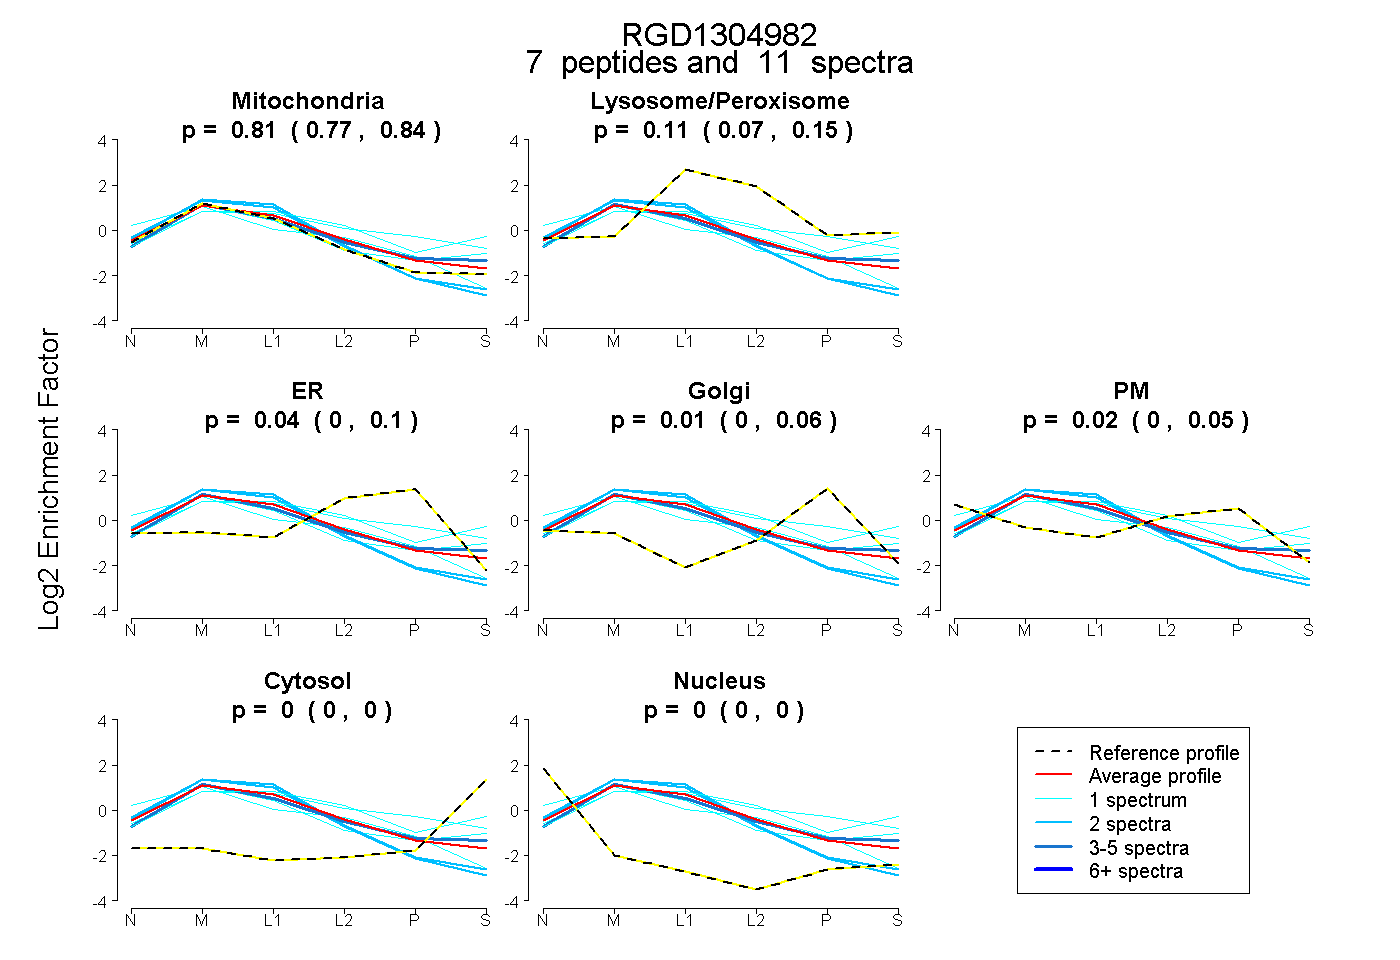 |
0.811 0.769 | 0.841 |
0.114 0.073 | 0.154 |
0.044 0.000 | 0.096 |
0.012 0.000 | 0.064 |
0.019 0.000 | 0.052 |
0.000 0.000 | 0.000 |
0.000 0.000 | 0.000 |
|||
| Plot | Lyso | Other | |||||||||||
| Expt C |
11 peptides |
85 spectra |
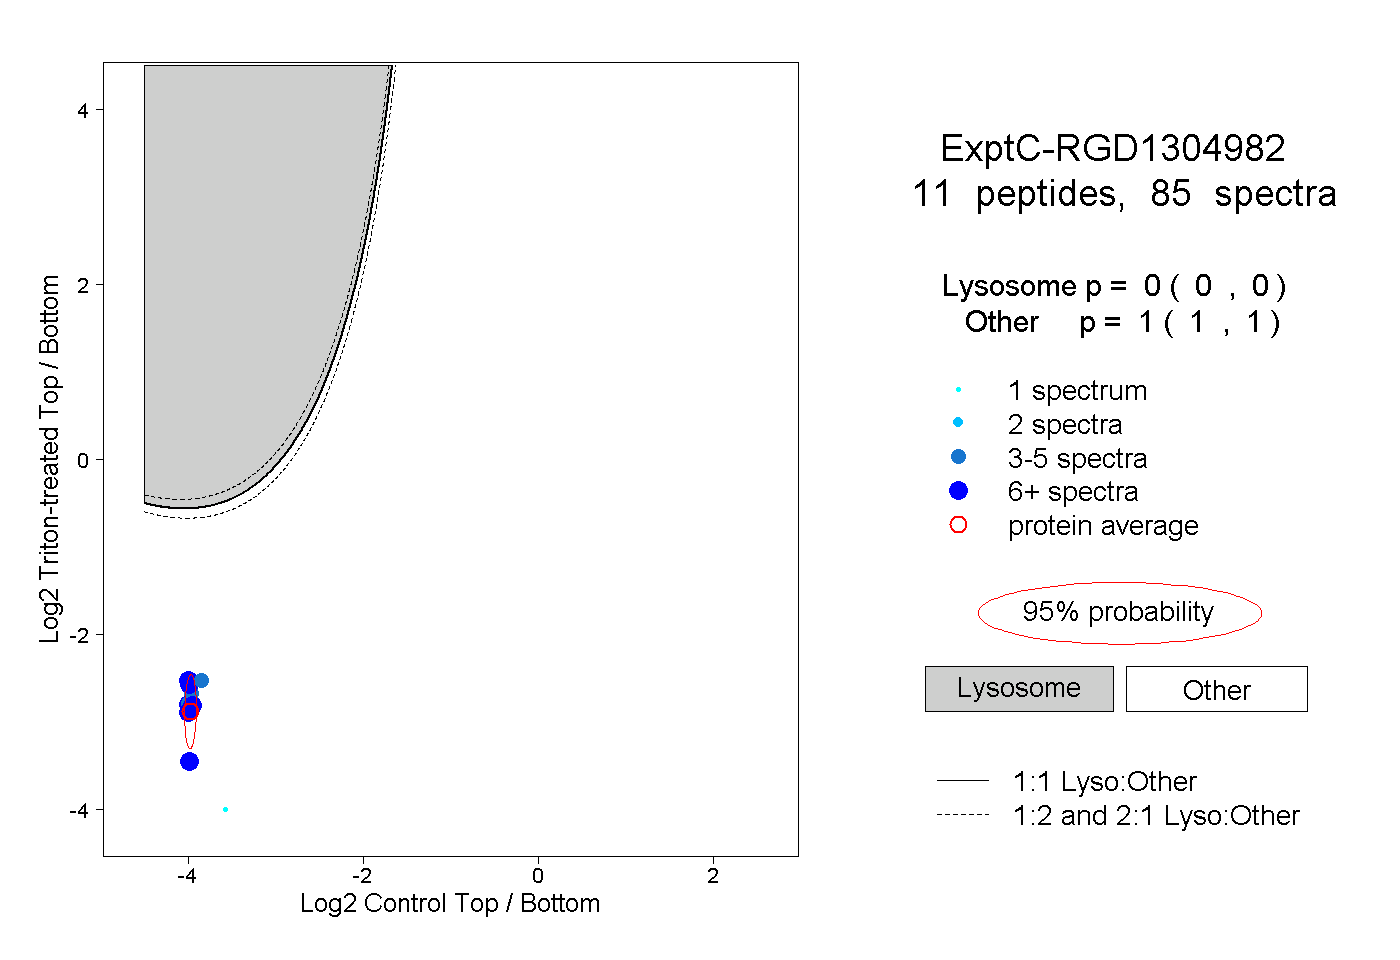 |
0.000 0.000 | 0.000 |
1.000 1.000 | 1.000 |
||||||||
| Plot | Lyso | Other | |||||||||||
| Expt D |
5 peptides |
9 spectra |
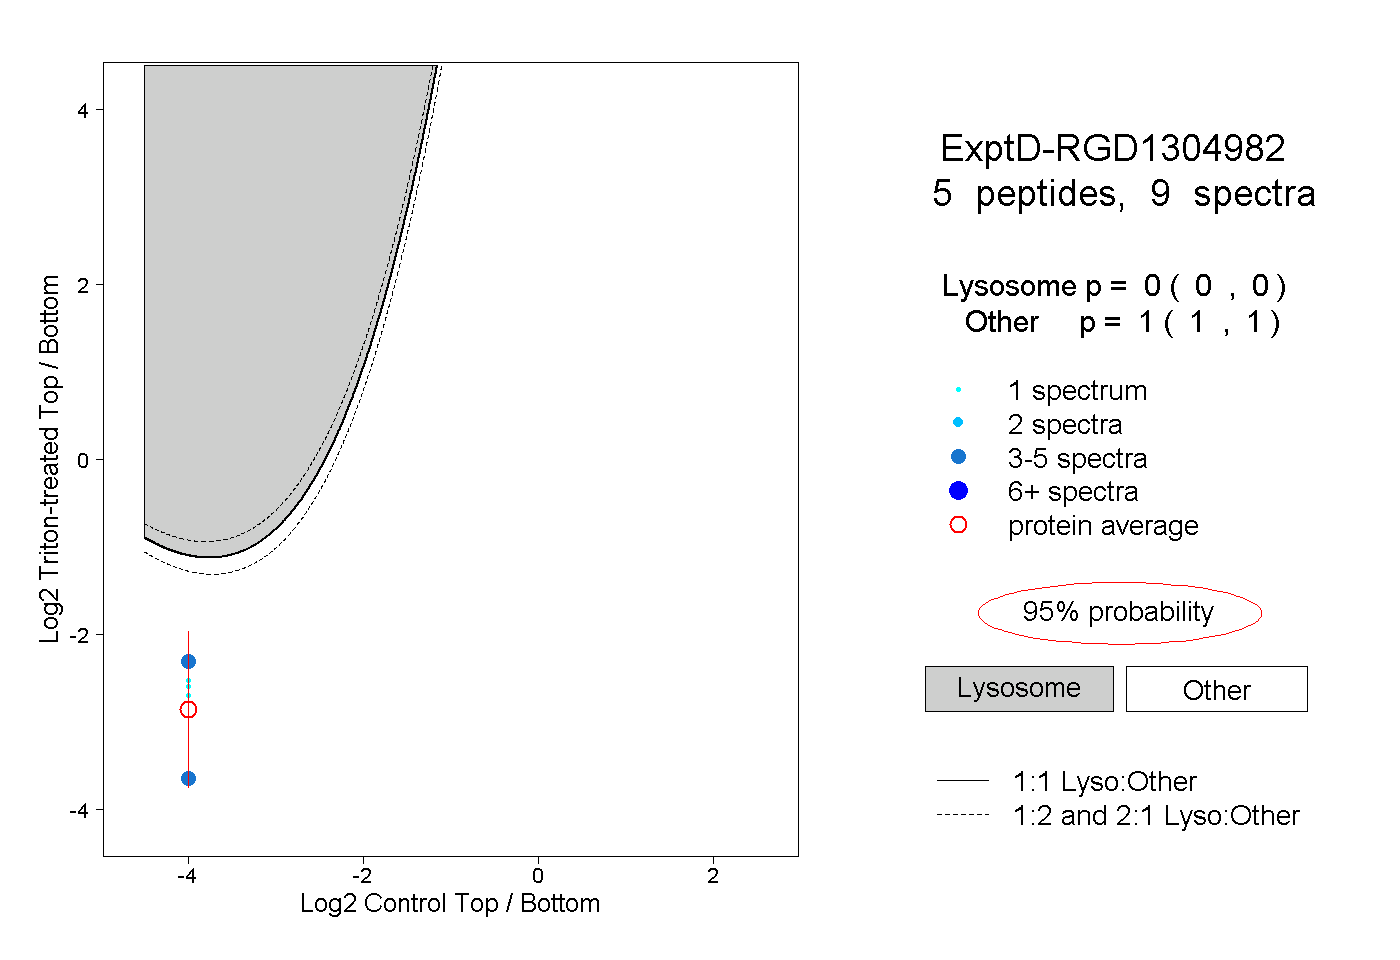 |
0.000 0.000 | 0.000 |
1.000 1.000 | 1.000 |