 4
4peptides
spectra
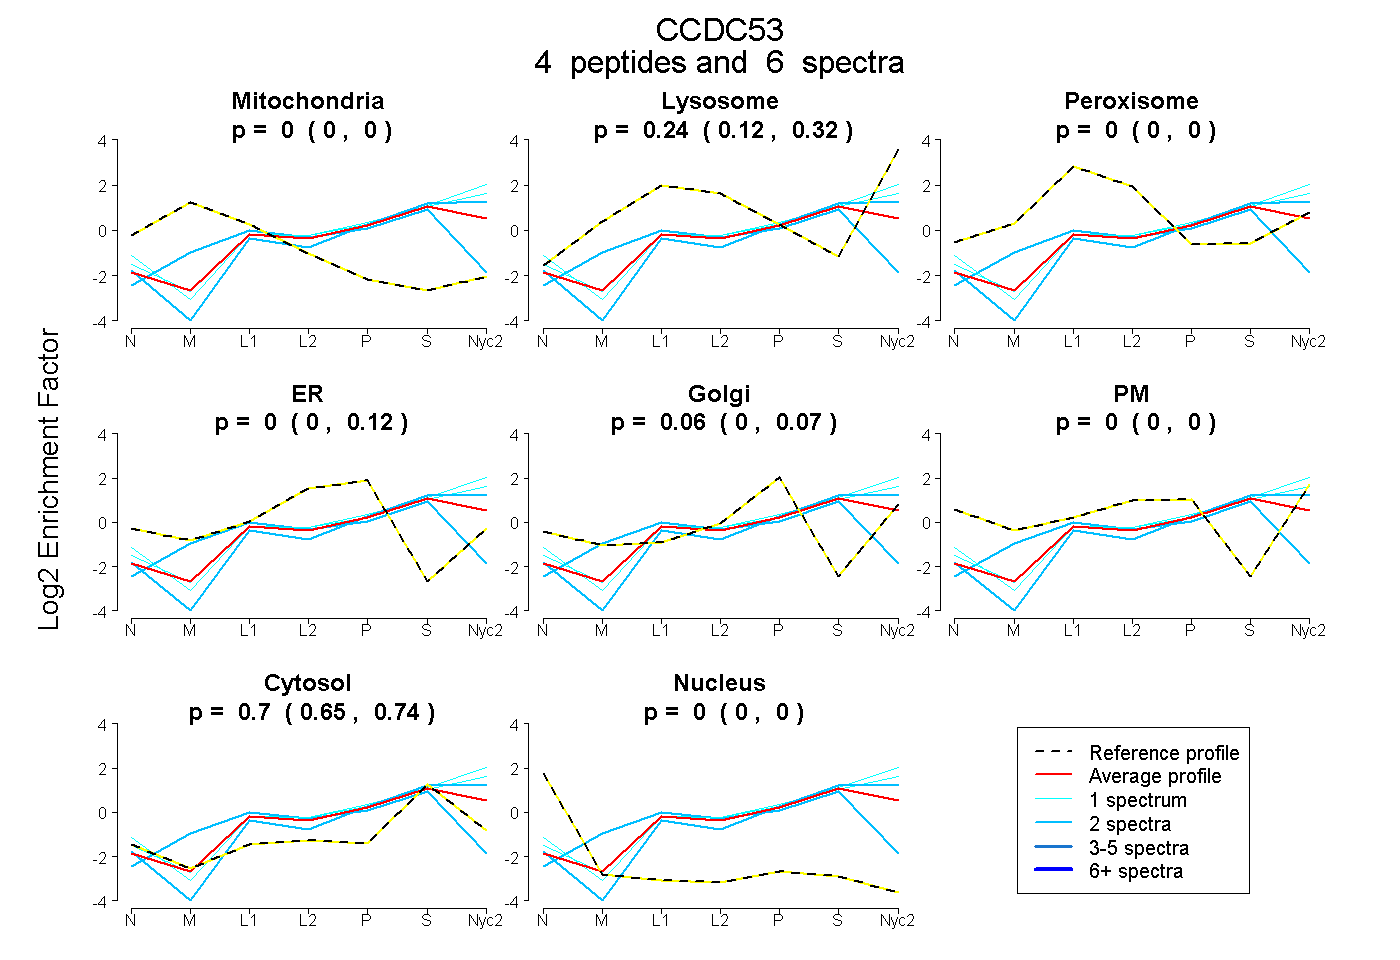
0.000 | 0.000
0.121 | 0.317
0.000 | 0.000
0.000 | 0.116
0.000 | 0.075
0.000 | 0.000
0.648 | 0.742
0.000 | 0.000
4peptides
spectra
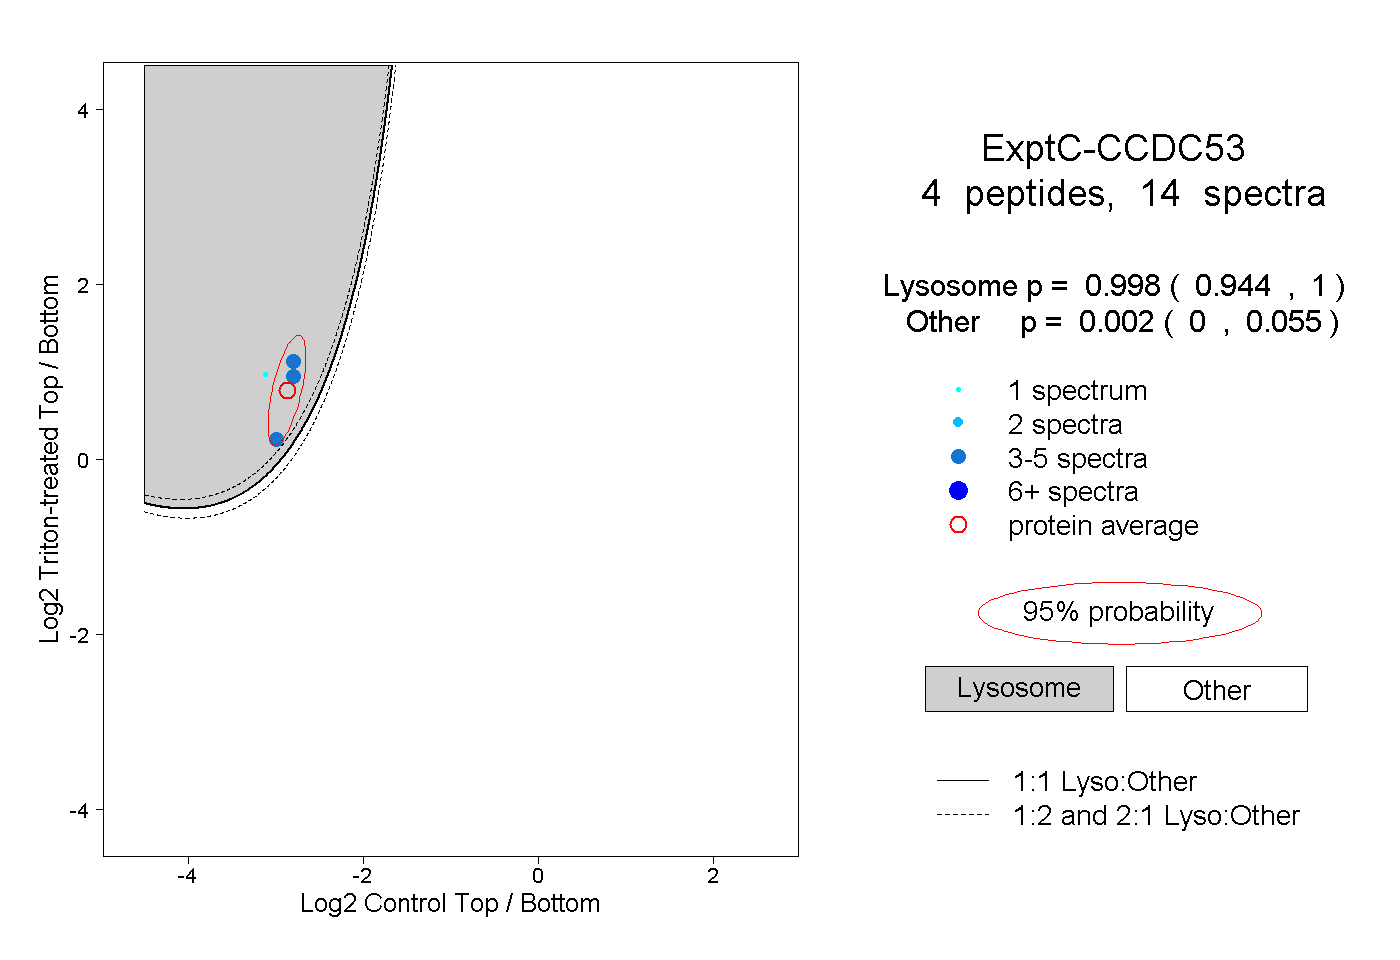
0.944 | 1.000
0.000 | 0.055
1peptide
spectra
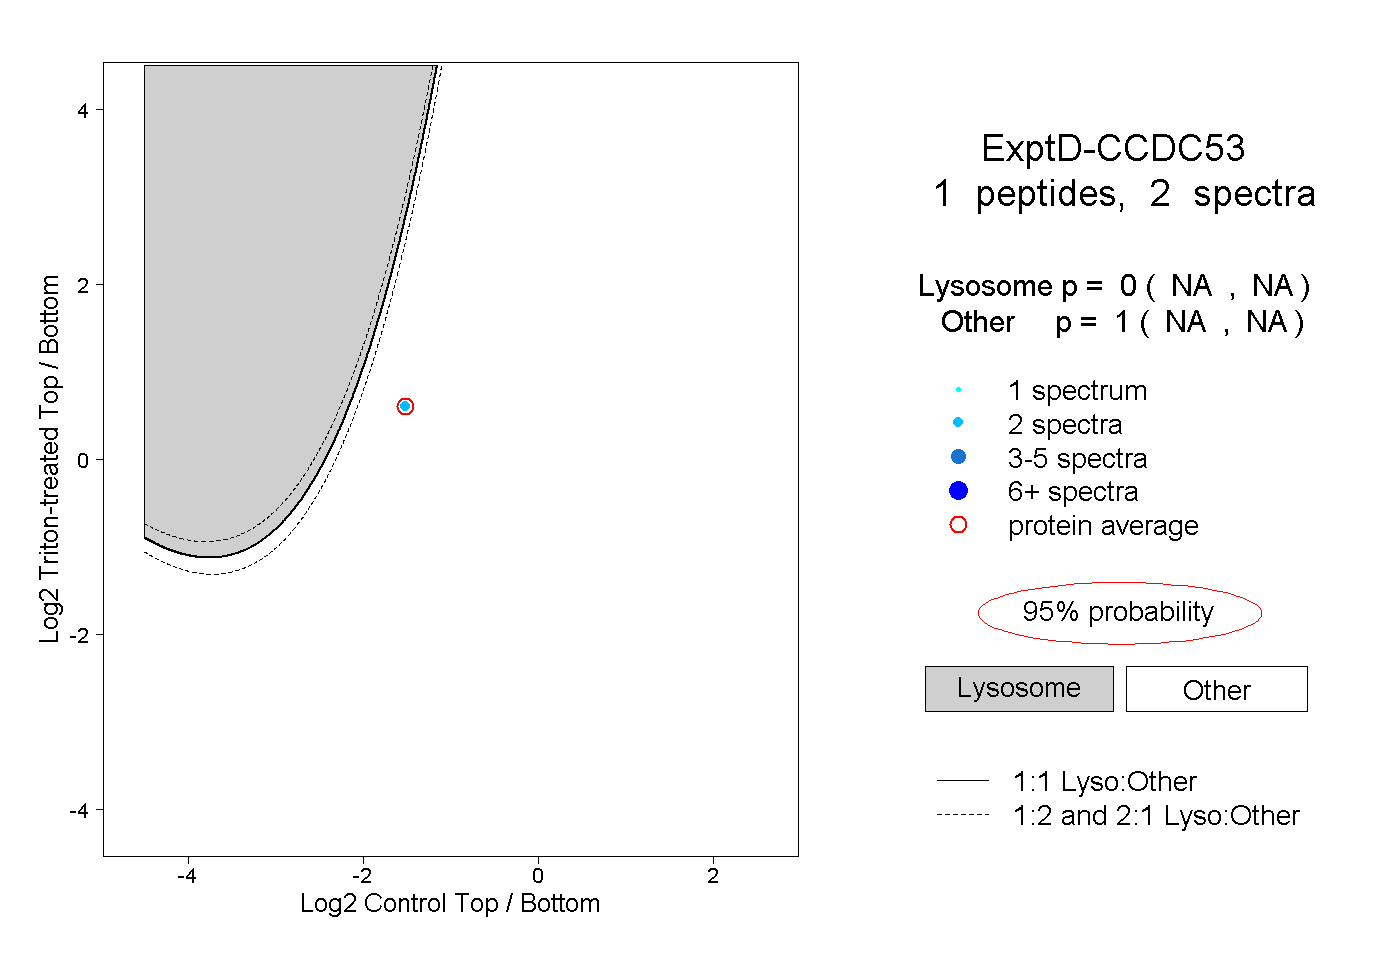
NA | NA
NA | NA