 4
4peptides
spectra
0.000 | 0.000
0.121 | 0.317
0.000 | 0.000
0.000 | 0.116
0.000 | 0.075
0.000 | 0.000
0.648 | 0.742
0.000 | 0.000
| Plot | Mito | Lyso | Perox | ER | Golgi | PM | Cytosol | Nucleus | |||||
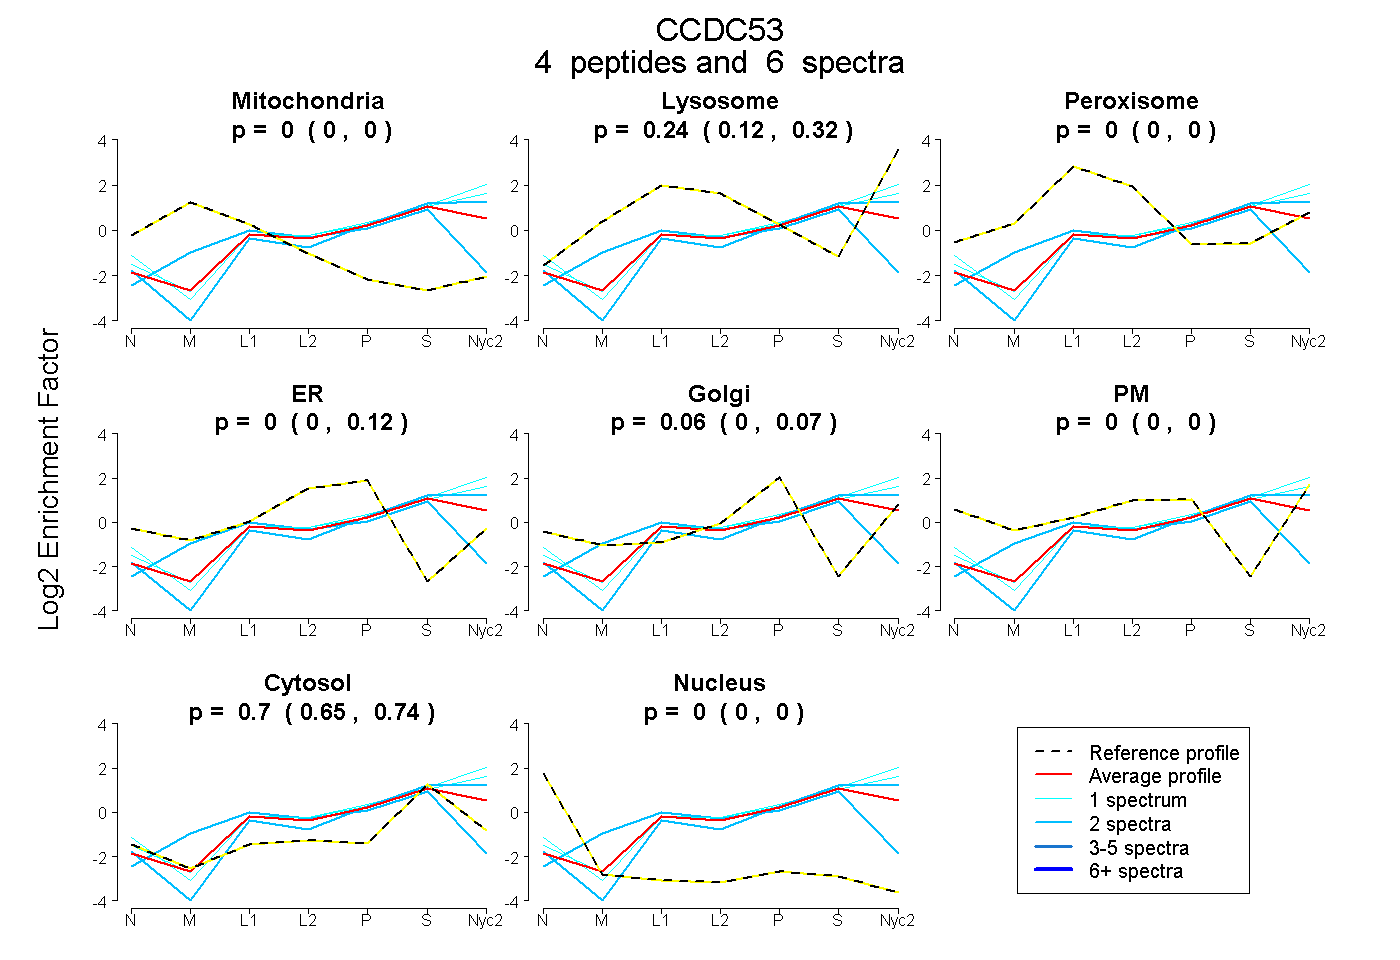
| Expt A |
4 peptides |
6 spectra |
|
0.000 0.000 | 0.000 |
0.243 0.121 | 0.317 |
0.000 0.000 | 0.000 |
0.000 0.000 | 0.116 |
0.058 0.000 | 0.075 |
0.000 0.000 | 0.000 |
0.699 0.648 | 0.742 |
0.000 0.000 | 0.000 |
| 1 spectrum, MVQVGVPVMAIR | 0.000 | 0.308 | 0.000 | 0.000 | 0.079 | 0.000 | 0.613 | 0.000 | ||
| 2 spectra, FSAVCEEK | 0.042 | 0.000 | 0.174 | 0.132 | 0.000 | 0.000 | 0.653 | 0.000 | ||
| 2 spectra, VPAIQQK | 0.000 | 0.205 | 0.000 | 0.000 | 0.047 | 0.000 | 0.748 | 0.000 | ||
| 1 spectrum, LADLSLR | 0.000 | 0.395 | 0.000 | 0.000 | 0.002 | 0.000 | 0.603 | 0.000 |
| Plot | Lyso | Other | |||||||||||
| Expt C |
4 peptides |
14 spectra |
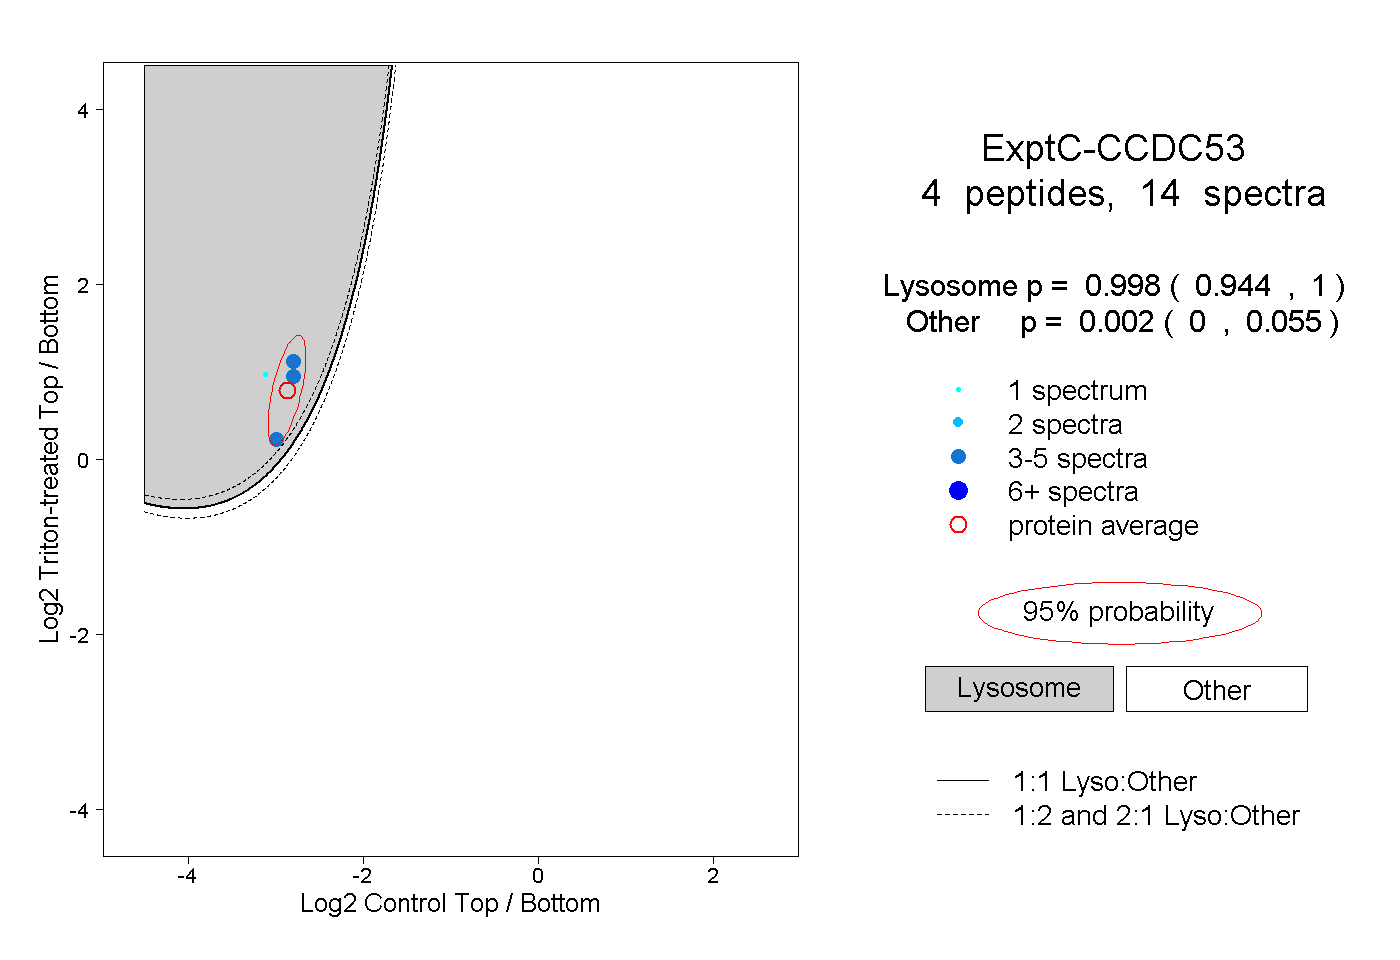 |
0.998 0.944 | 1.000 |
0.002 0.000 | 0.055 |
||||||||
| Plot | Lyso | Other | |||||||||||
| Expt D |
1 peptide |
2 spectra |
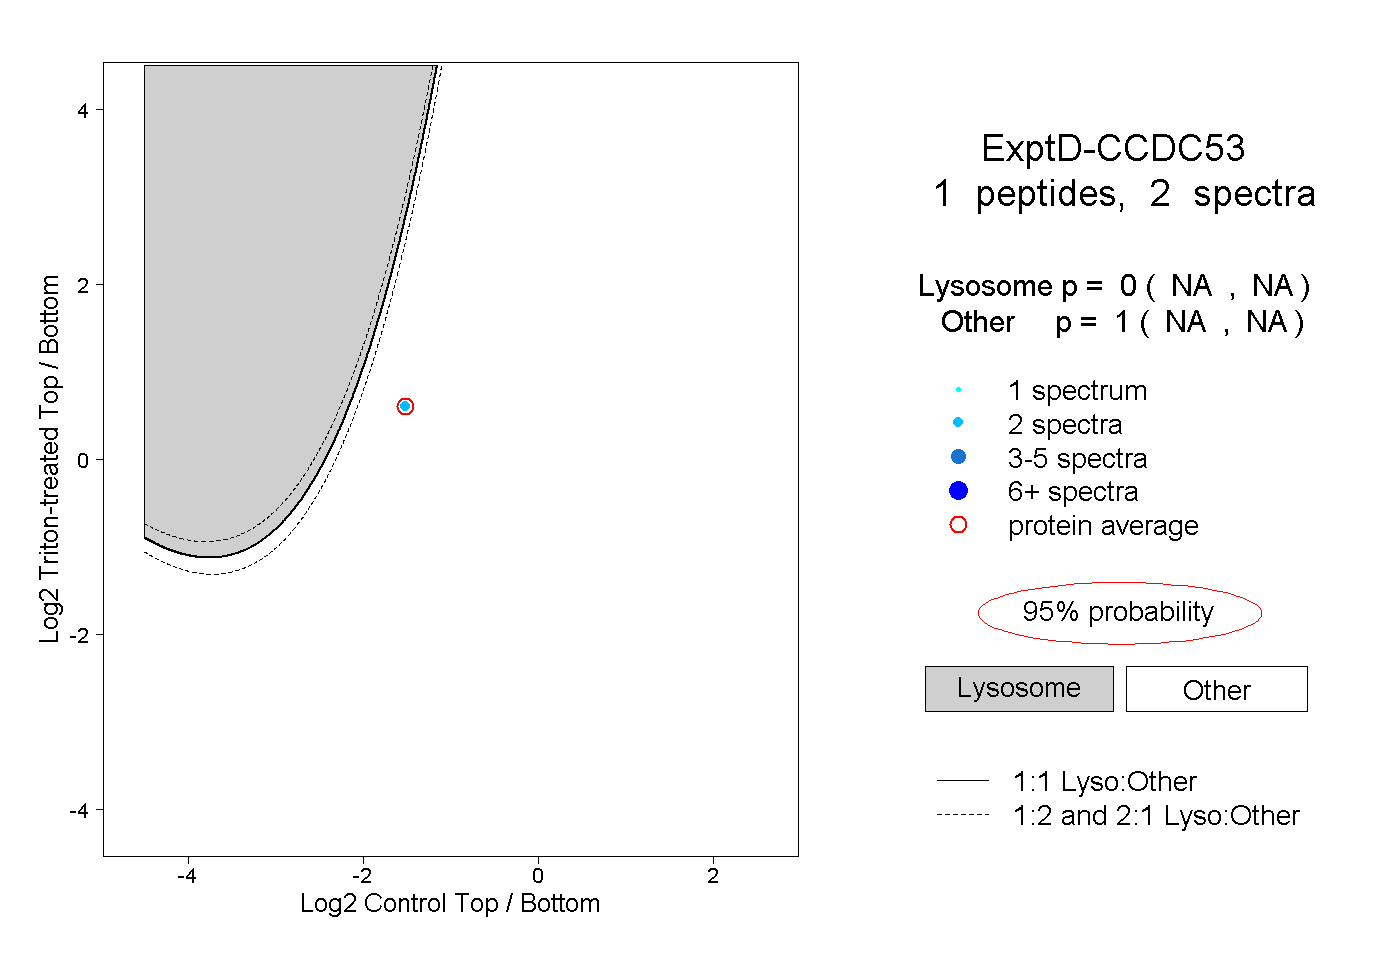 |
0.000 NA | NA |
1.000 NA | NA |