 6
6peptides
spectra
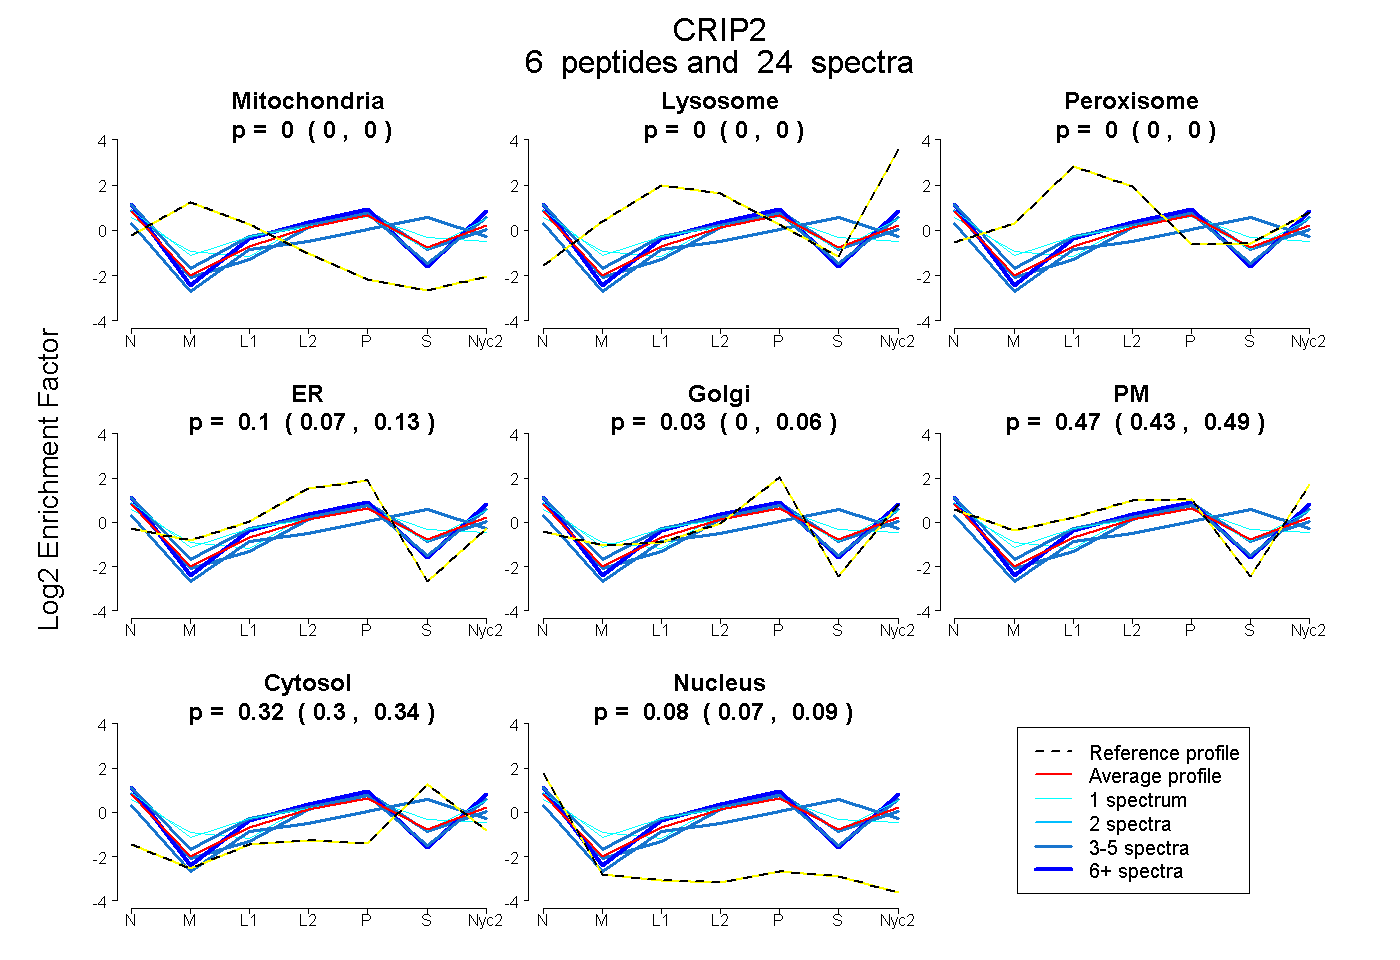
0.000 | 0.000
0.000 | 0.000
0.000 | 0.000
0.067 | 0.130
0.000 | 0.061
0.434 | 0.494
0.298 | 0.343
0.065 | 0.090
2peptides
spectra
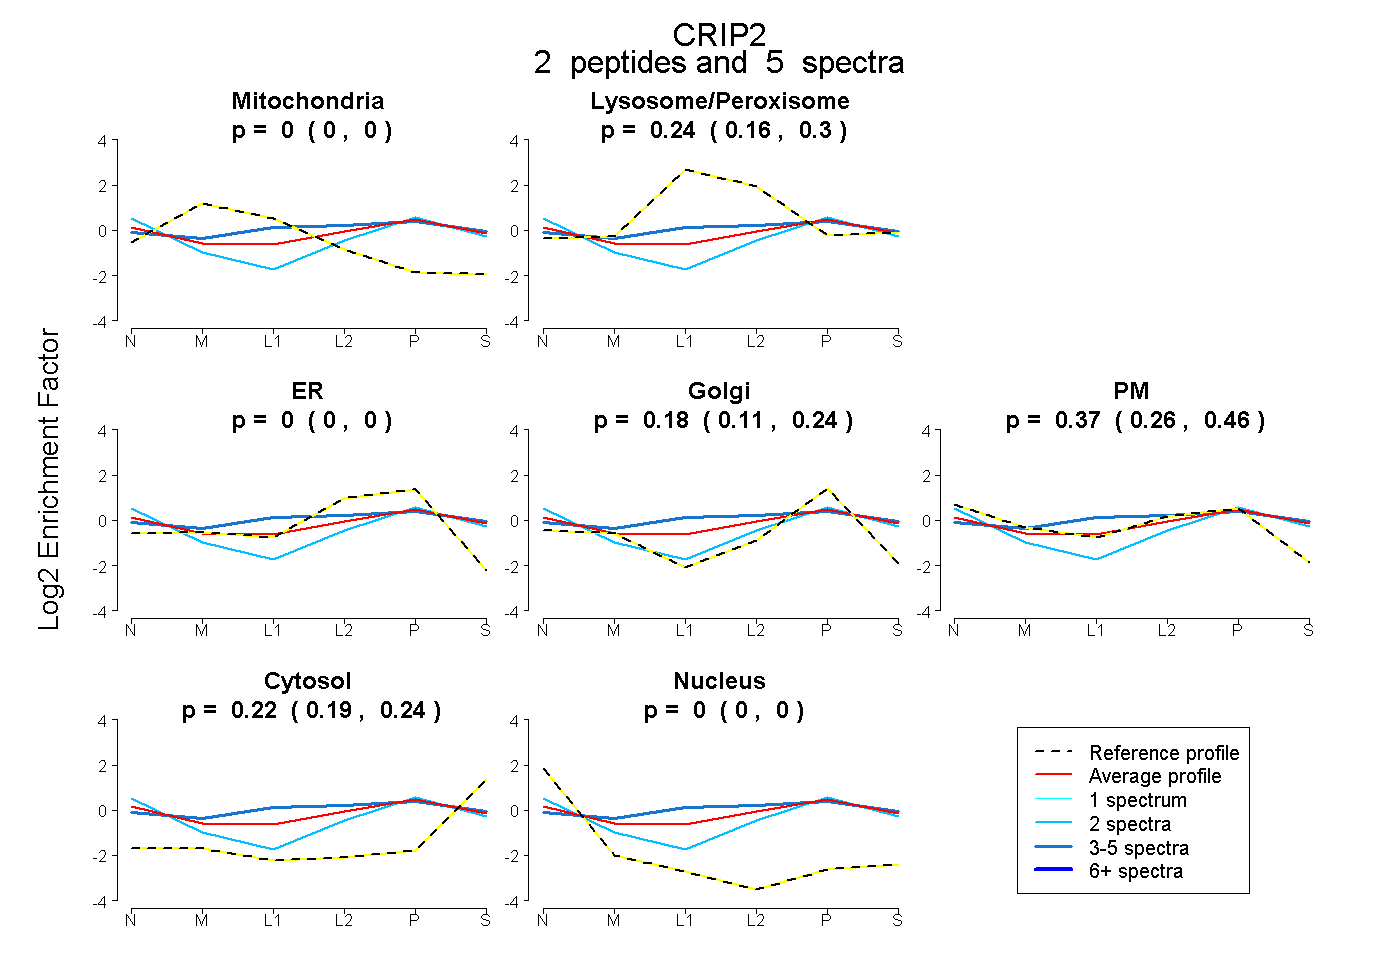
0.000 | 0.000
0.159 | 0.300
0.000 | 0.000
0.112 | 0.236
0.256 | 0.458
0.187 | 0.241
0.000 | 0.000
5peptides
spectra
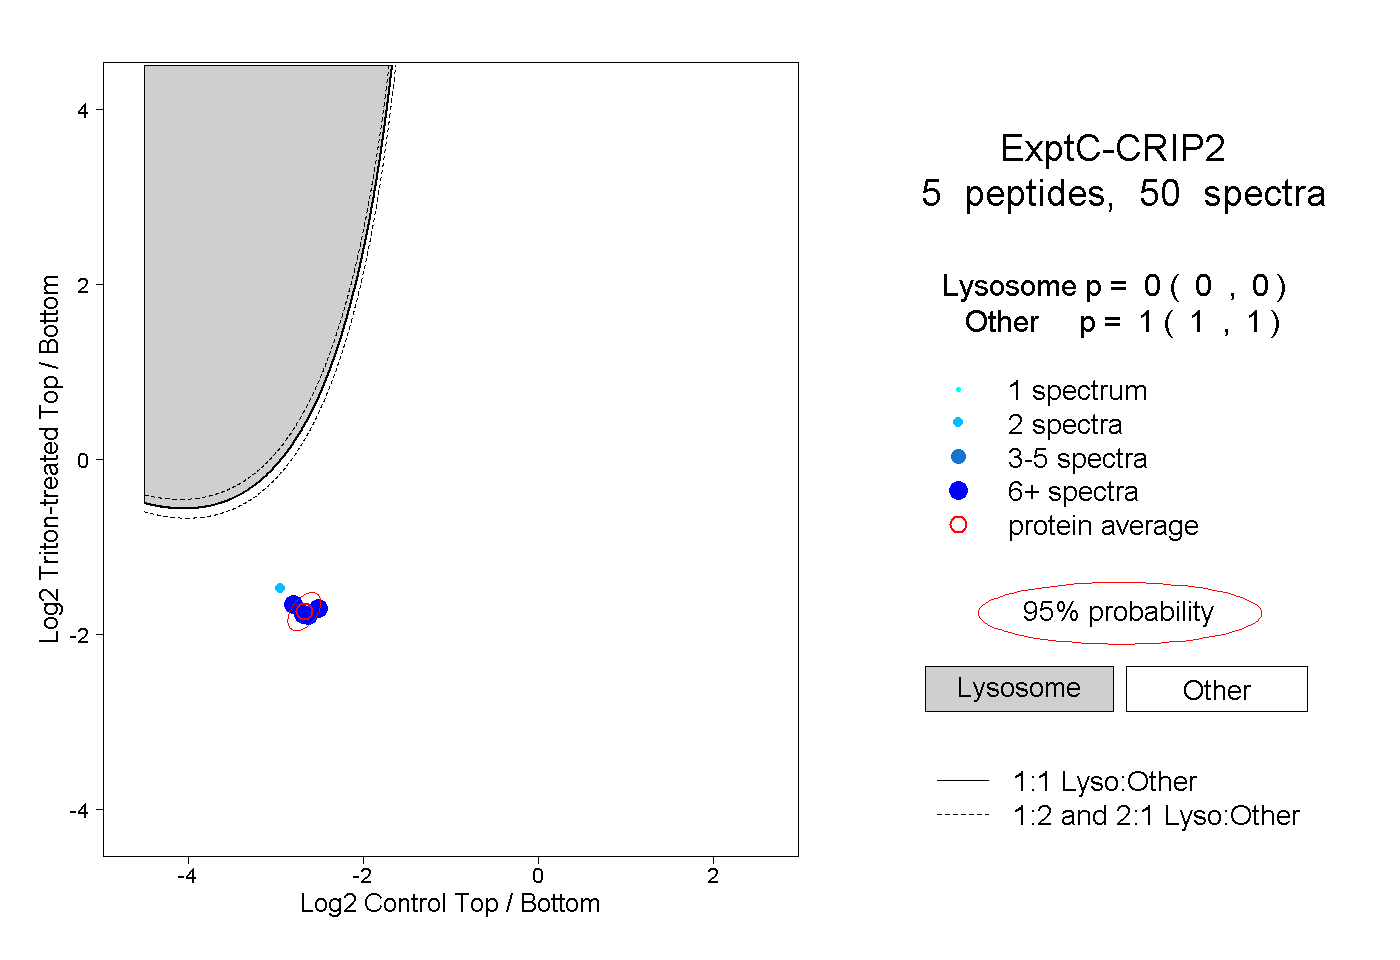
0.000 | 0.000
1.000 | 1.000
3peptides
spectra
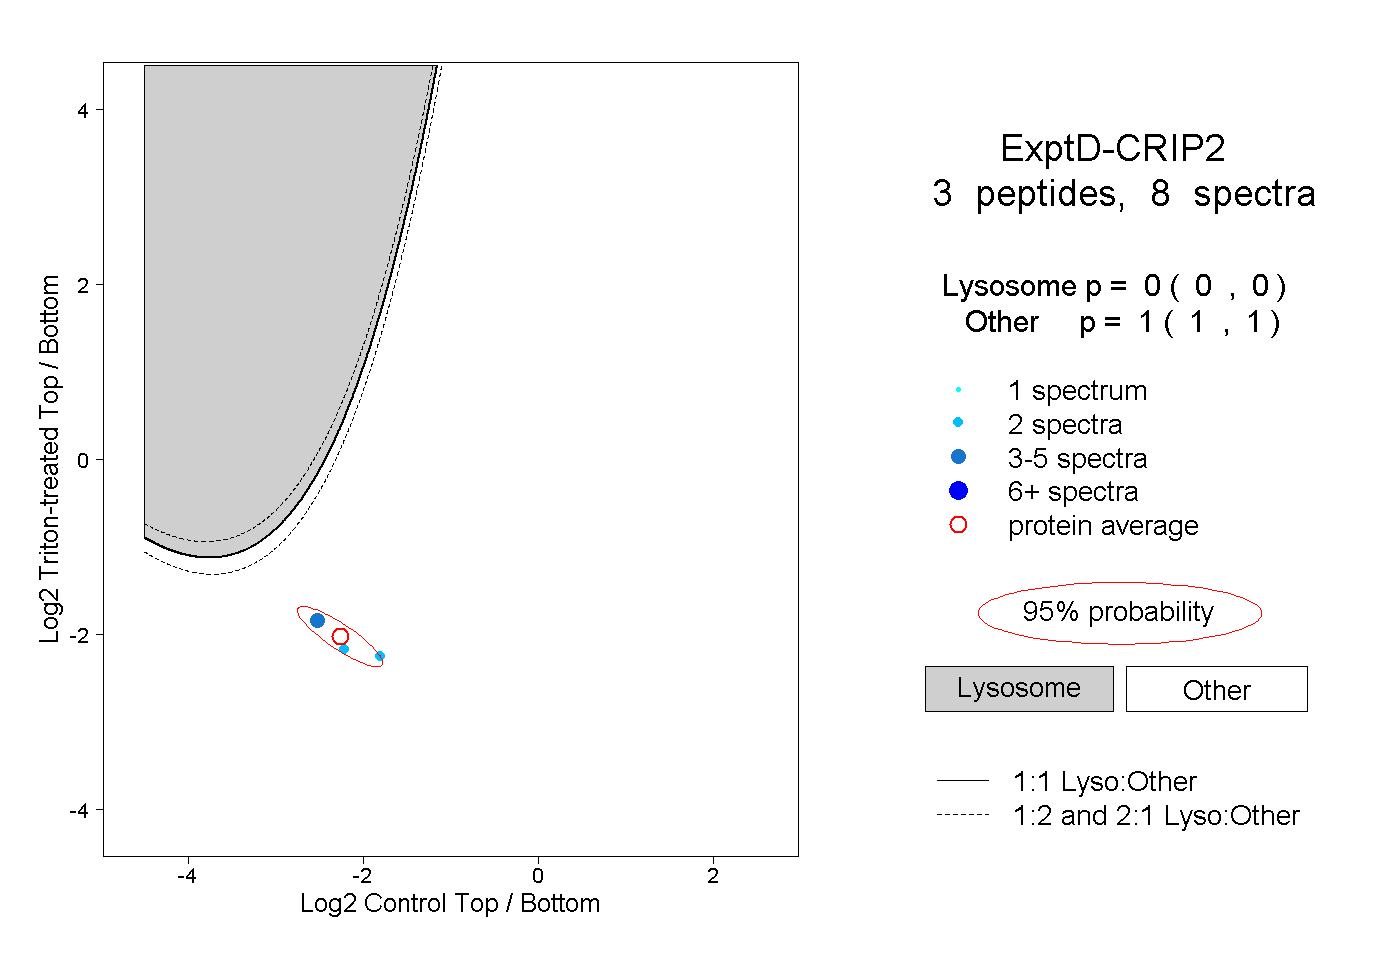
0.000 | 0.000
1.000 | 1.000