 6
6peptides
spectra
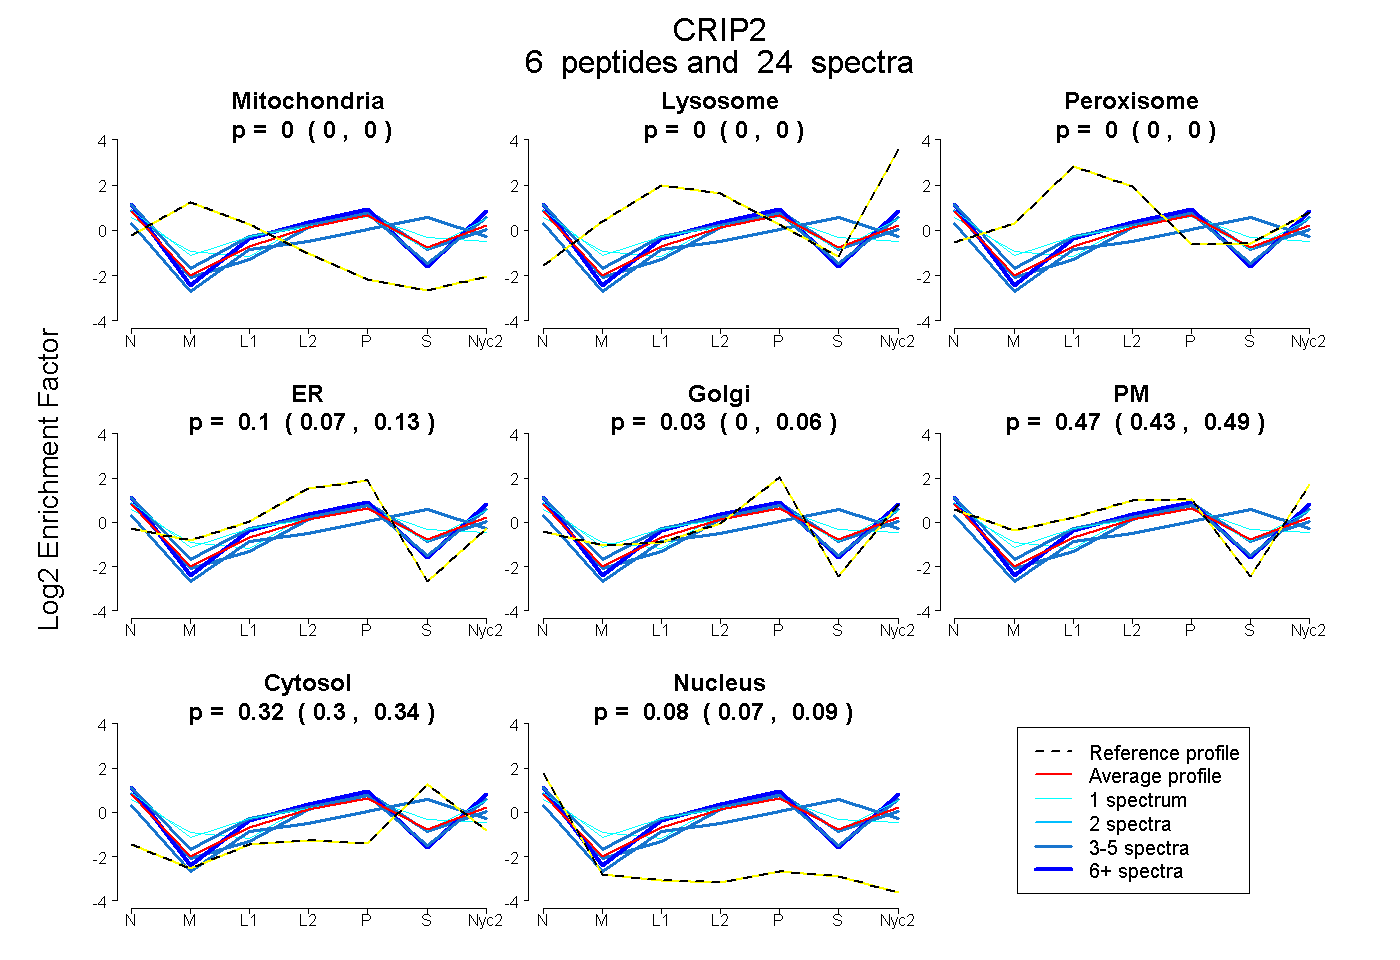
0.000 | 0.000
0.000 | 0.000
0.000 | 0.000
0.067 | 0.130
0.000 | 0.061
0.434 | 0.494
0.298 | 0.343
0.065 | 0.090
| Plot | Mito | Lyso | Perox | ER | Golgi | PM | Cytosol | Nucleus | |||||
| Expt A |
6 peptides |
24 spectra |
|
0.000 0.000 | 0.000 |
0.000 0.000 | 0.000 |
0.000 0.000 | 0.000 |
0.101 0.067 | 0.130 |
0.031 0.000 | 0.061 |
0.467 0.434 | 0.494 |
0.322 0.298 | 0.343 |
0.079 0.065 | 0.090 |
| 1 spectrum, DWHRPCLR | 0.000 | 0.000 | 0.000 | 0.307 | 0.000 | 0.259 | 0.376 | 0.059 | ||
| 4 spectra, VYFAEK | 0.000 | 0.000 | 0.000 | 0.052 | 0.000 | 0.266 | 0.654 | 0.027 | ||
| 4 spectra, ASSVTTFTGEPNMCPR | 0.000 | 0.000 | 0.000 | 0.099 | 0.242 | 0.277 | 0.277 | 0.105 | ||
| 4 spectra, TVYFAEK | 0.000 | 0.000 | 0.000 | 0.044 | 0.000 | 0.680 | 0.162 | 0.113 | ||
| 10 spectra, TSGPPK | 0.000 | 0.000 | 0.000 | 0.009 | 0.115 | 0.620 | 0.155 | 0.101 | ||
| 1 spectrum, VTSLGK | 0.000 | 0.000 | 0.003 | 0.000 | 0.000 | 0.670 | 0.277 | 0.049 |
| Plot | Mito | Lyso or Perox | ER | Golgi | PM | Cytosol | Nucleus | ||||||
| Expt B |
2 peptides |
5 spectra |
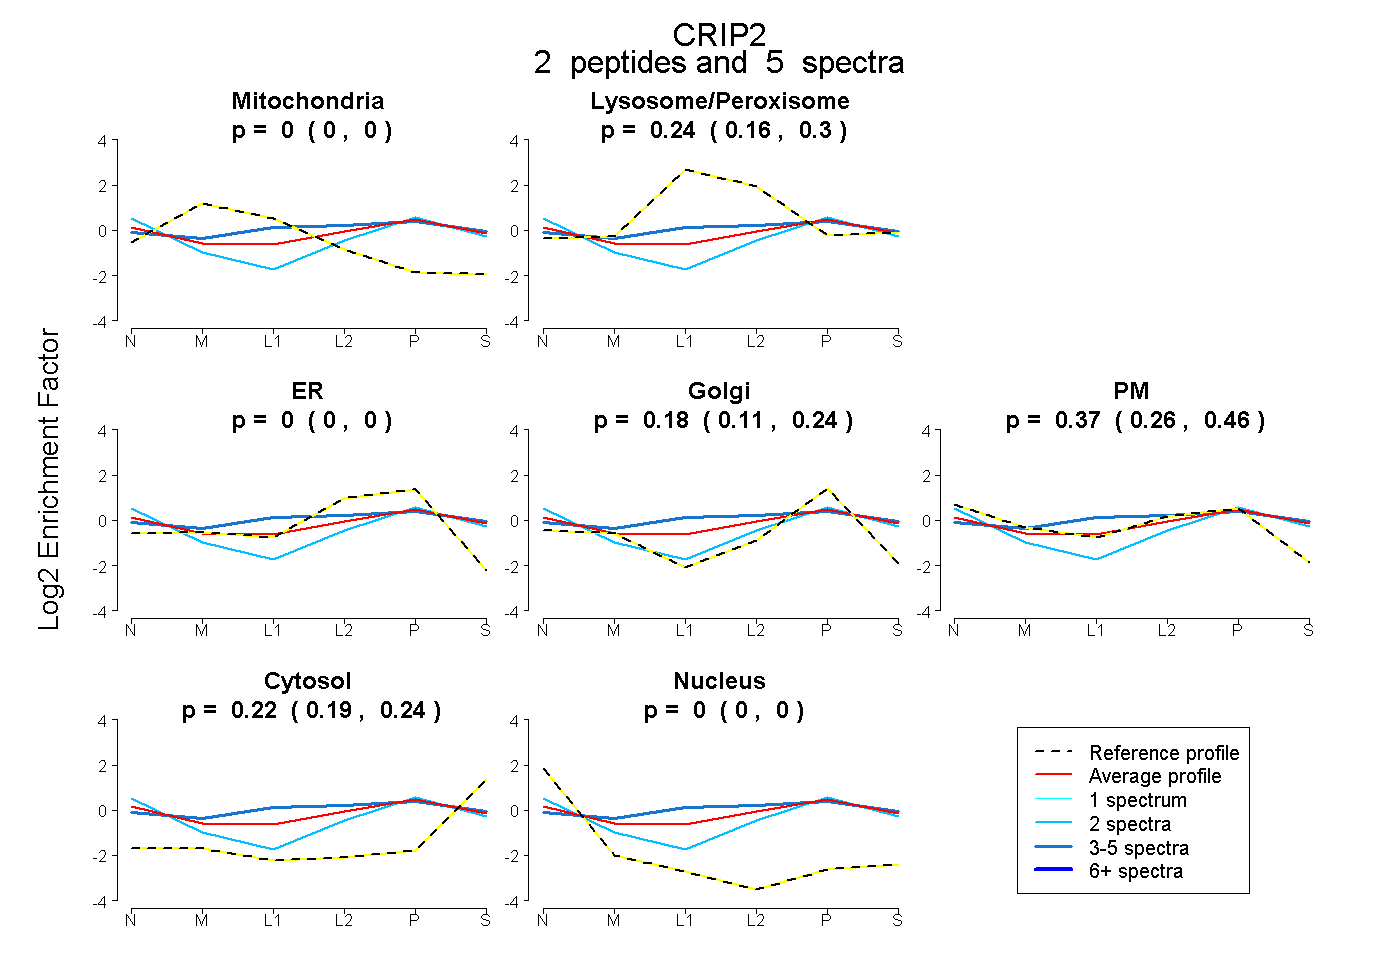 |
0.000 0.000 | 0.000 |
0.237 0.159 | 0.300 |
0.000 0.000 | 0.000 |
0.177 0.112 | 0.236 |
0.370 0.256 | 0.458 |
0.216 0.187 | 0.241 |
0.000 0.000 | 0.000 |
|||
| Plot | Lyso | Other | |||||||||||
| Expt C |
5 peptides |
50 spectra |
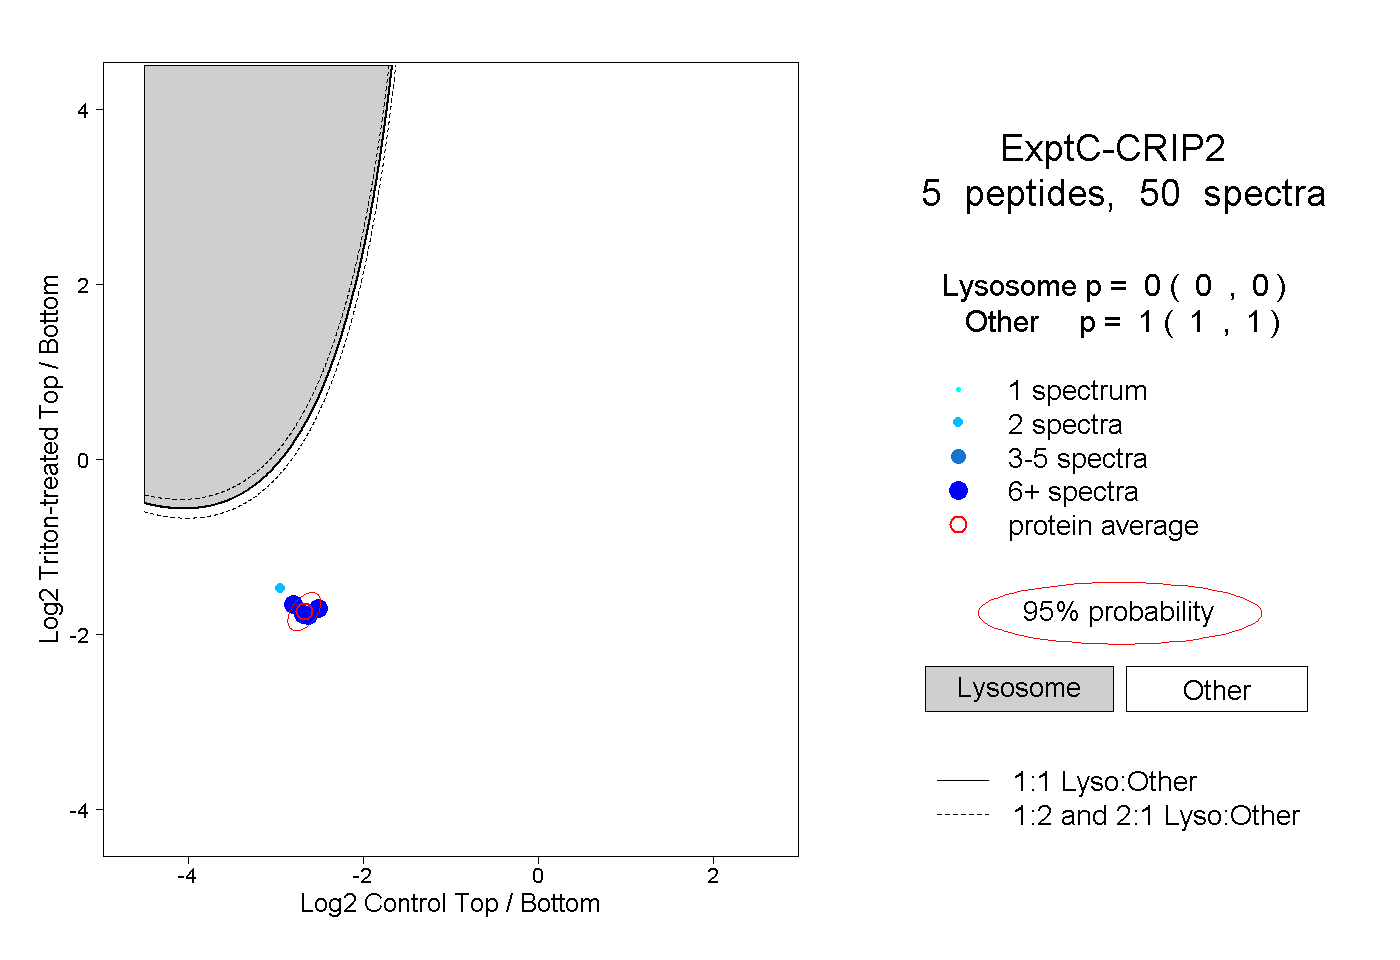 |
0.000 0.000 | 0.000 |
1.000 1.000 | 1.000 |
||||||||
| Plot | Lyso | Other | |||||||||||
| Expt D |
3 peptides |
8 spectra |
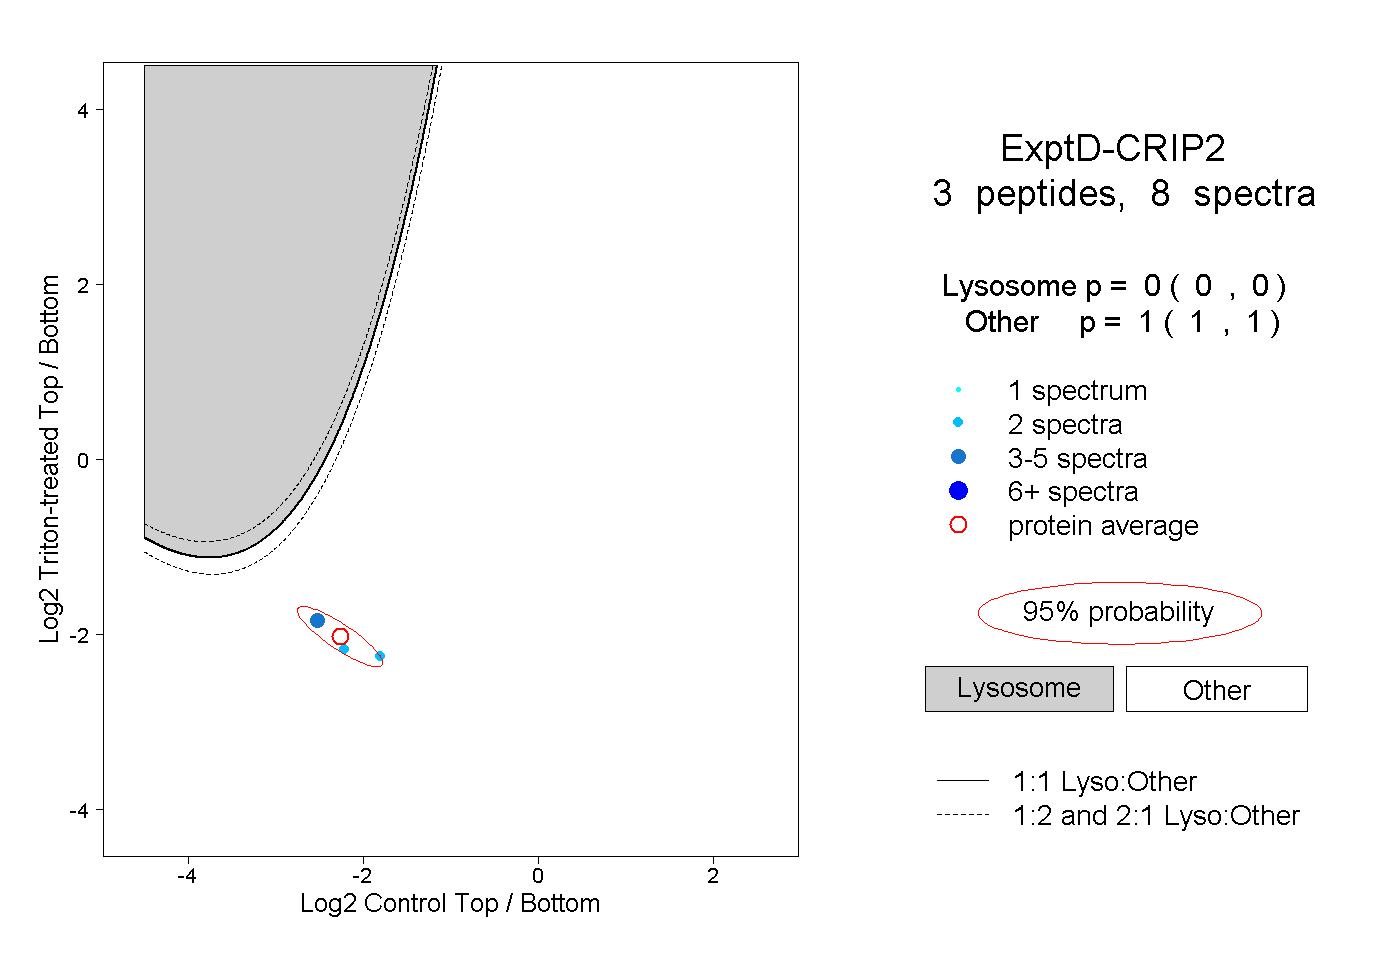 |
0.000 0.000 | 0.000 |
1.000 1.000 | 1.000 |