 4
4peptides
spectra
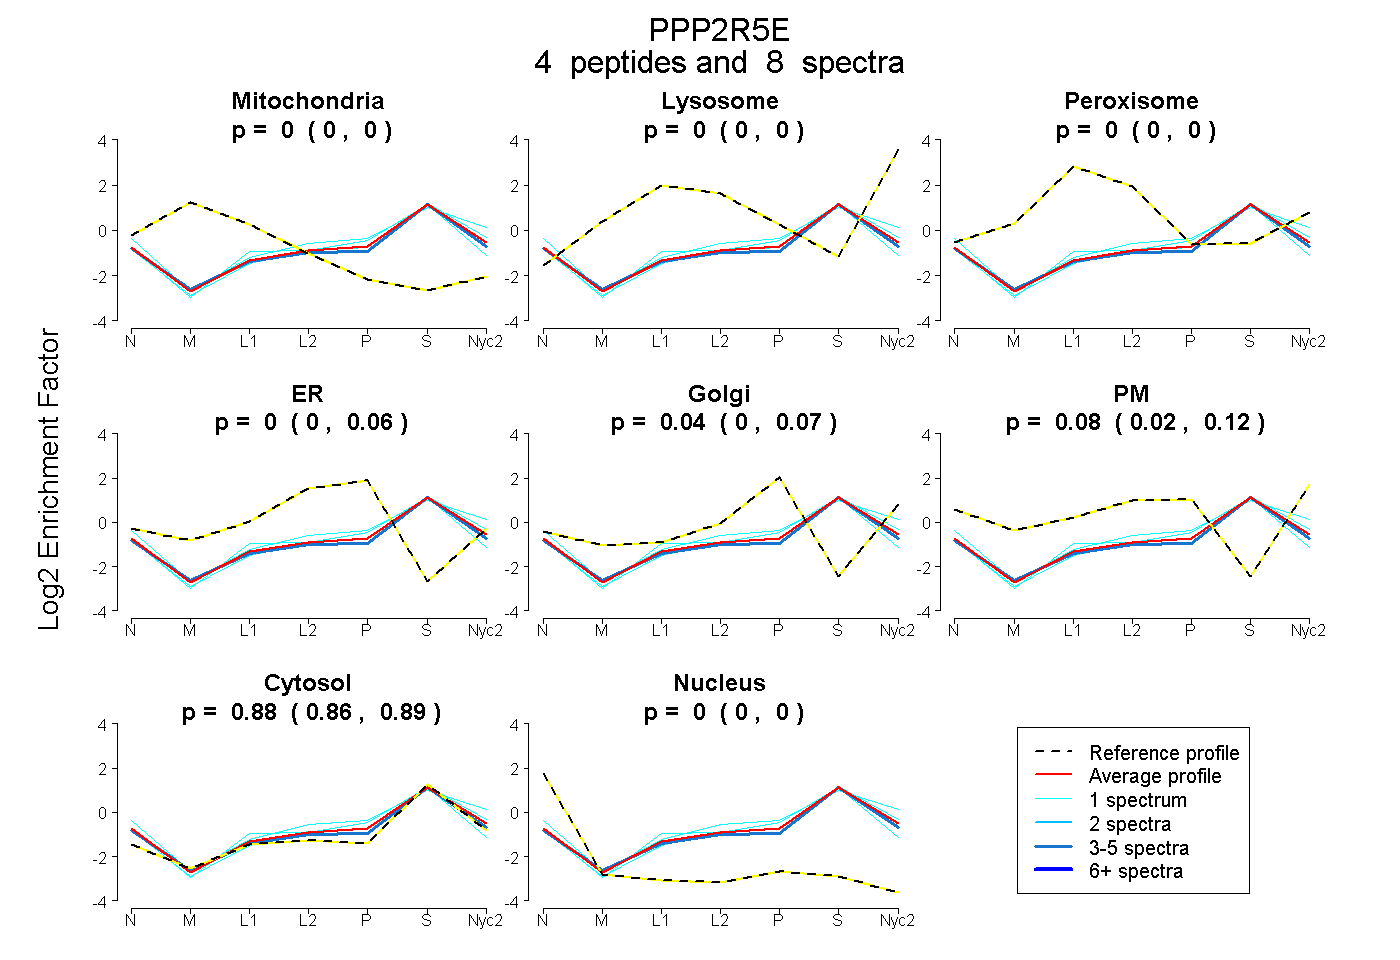
0.000 | 0.000
0.000 | 0.000
0.000 | 0.000
0.000 | 0.057
0.000 | 0.072
0.021 | 0.119
0.862 | 0.893
0.000 | 0.003
3peptides
spectra
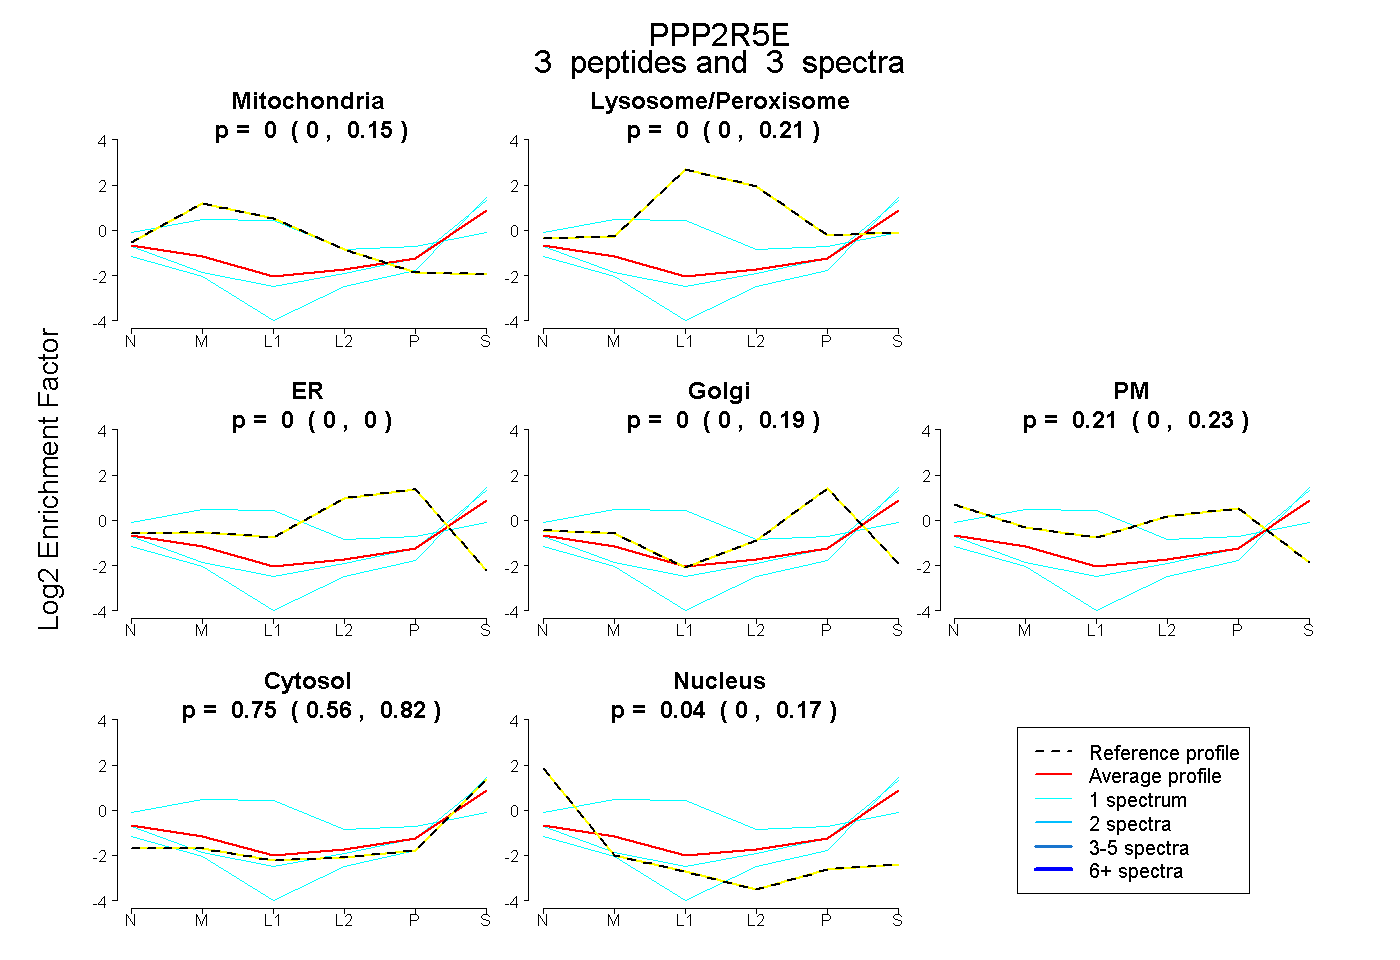
0.000 | 0.152
0.000 | 0.213
0.000 | 0.000
0.000 | 0.189
0.000 | 0.228
0.560 | 0.823
0.000 | 0.170
3peptides
spectra
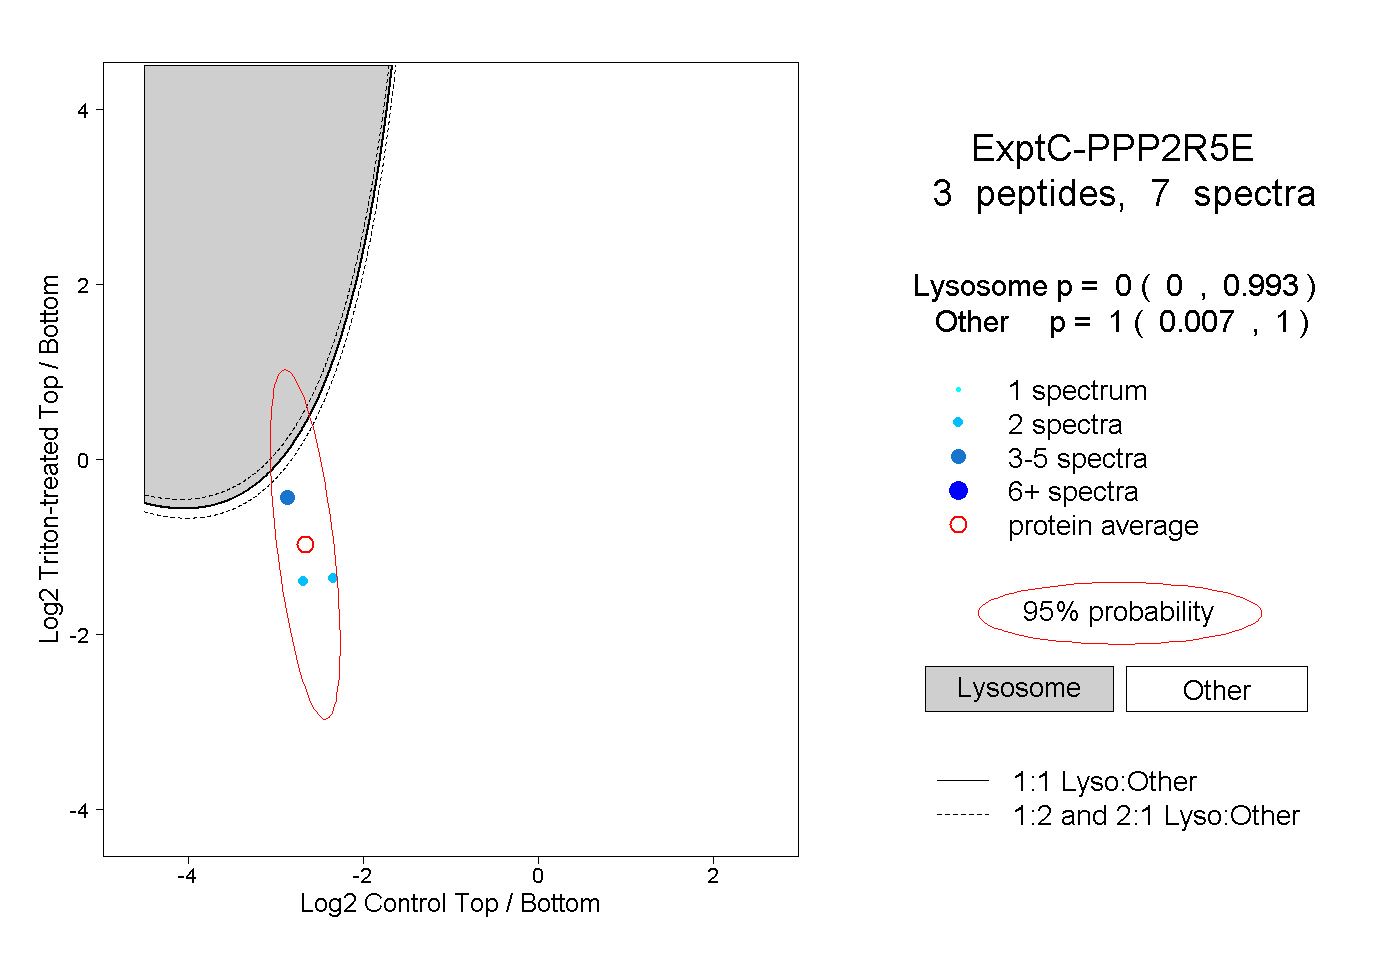
0.000 | 0.993
0.007 | 1.000