 4
4peptides
spectra
0.000 | 0.000
0.000 | 0.000
0.000 | 0.000
0.000 | 0.057
0.000 | 0.072
0.021 | 0.119
0.862 | 0.893
0.000 | 0.003
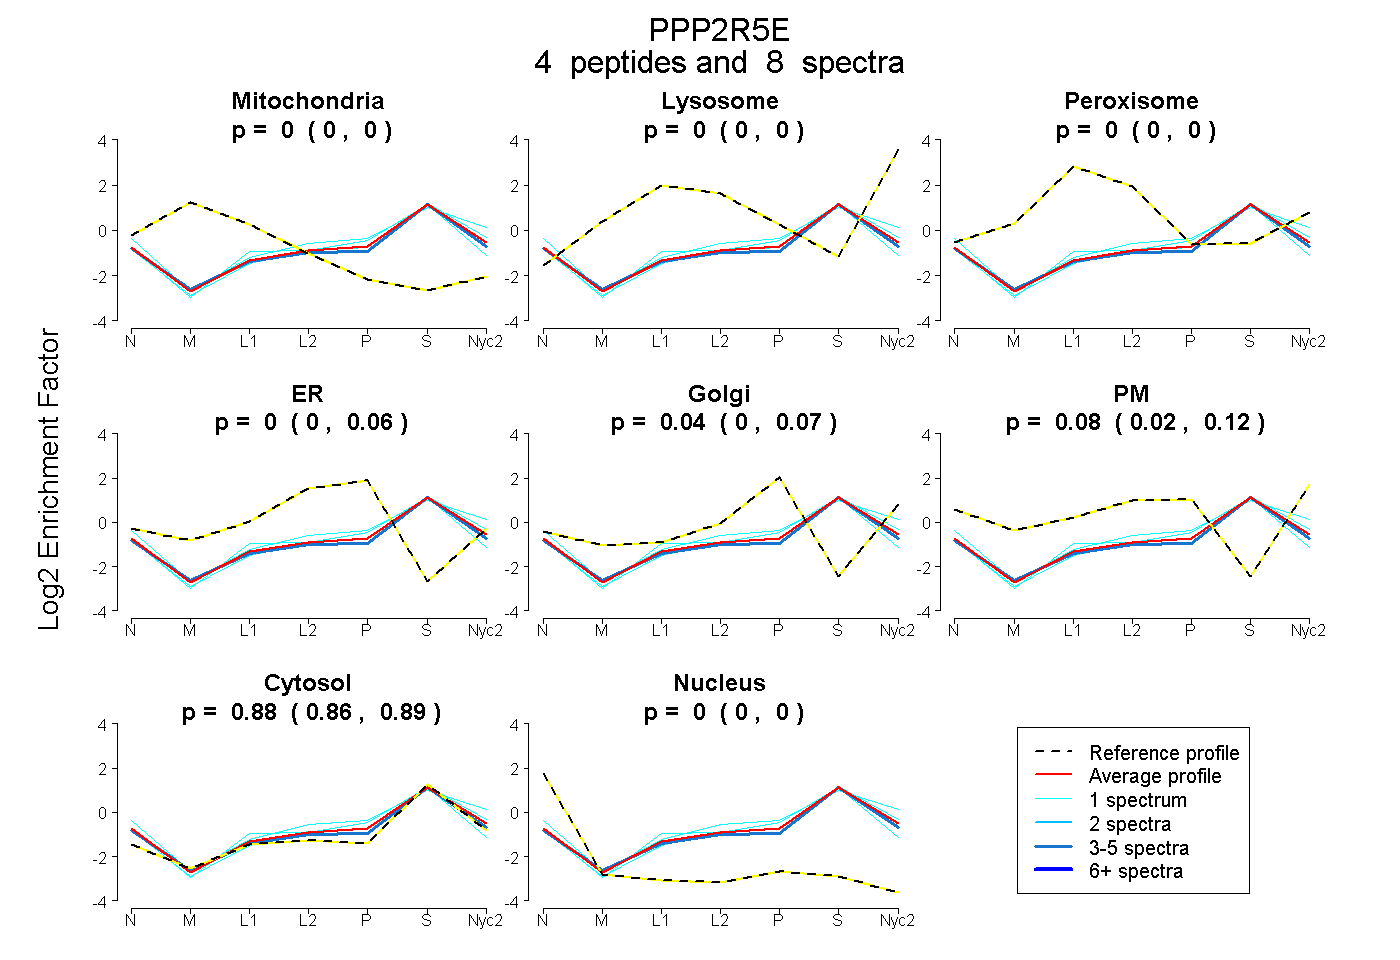
| Plot | Mito | Lyso | Perox | ER | Golgi | PM | Cytosol | Nucleus | |||||
| Expt A |
4 peptides |
8 spectra |
|
0.000 0.000 | 0.000 |
0.000 0.000 | 0.000 |
0.000 0.000 | 0.000 |
0.000 0.000 | 0.057 |
0.037 0.000 | 0.072 |
0.084 0.021 | 0.119 |
0.879 0.862 | 0.893 |
0.000 0.000 | 0.003 |
| 1 spectrum, FLESQEFQPSIAK | 0.000 | 0.000 | 0.000 | 0.000 | 0.000 | 0.225 | 0.775 | 0.000 | ||
| 5 spectra, VLIPLHTVR | 0.000 | 0.000 | 0.000 | 0.020 | 0.000 | 0.067 | 0.901 | 0.012 | ||
| 1 spectrum, IQEPLFK | 0.000 | 0.000 | 0.000 | 0.000 | 0.058 | 0.055 | 0.887 | 0.000 | ||
| 1 spectrum, GCLTEQTYPEVVR | 0.000 | 0.000 | 0.000 | 0.127 | 0.000 | 0.000 | 0.873 | 0.000 |
| Plot | Mito | Lyso or Perox | ER | Golgi | PM | Cytosol | Nucleus | ||||||
| Expt B |
3 peptides |
3 spectra |
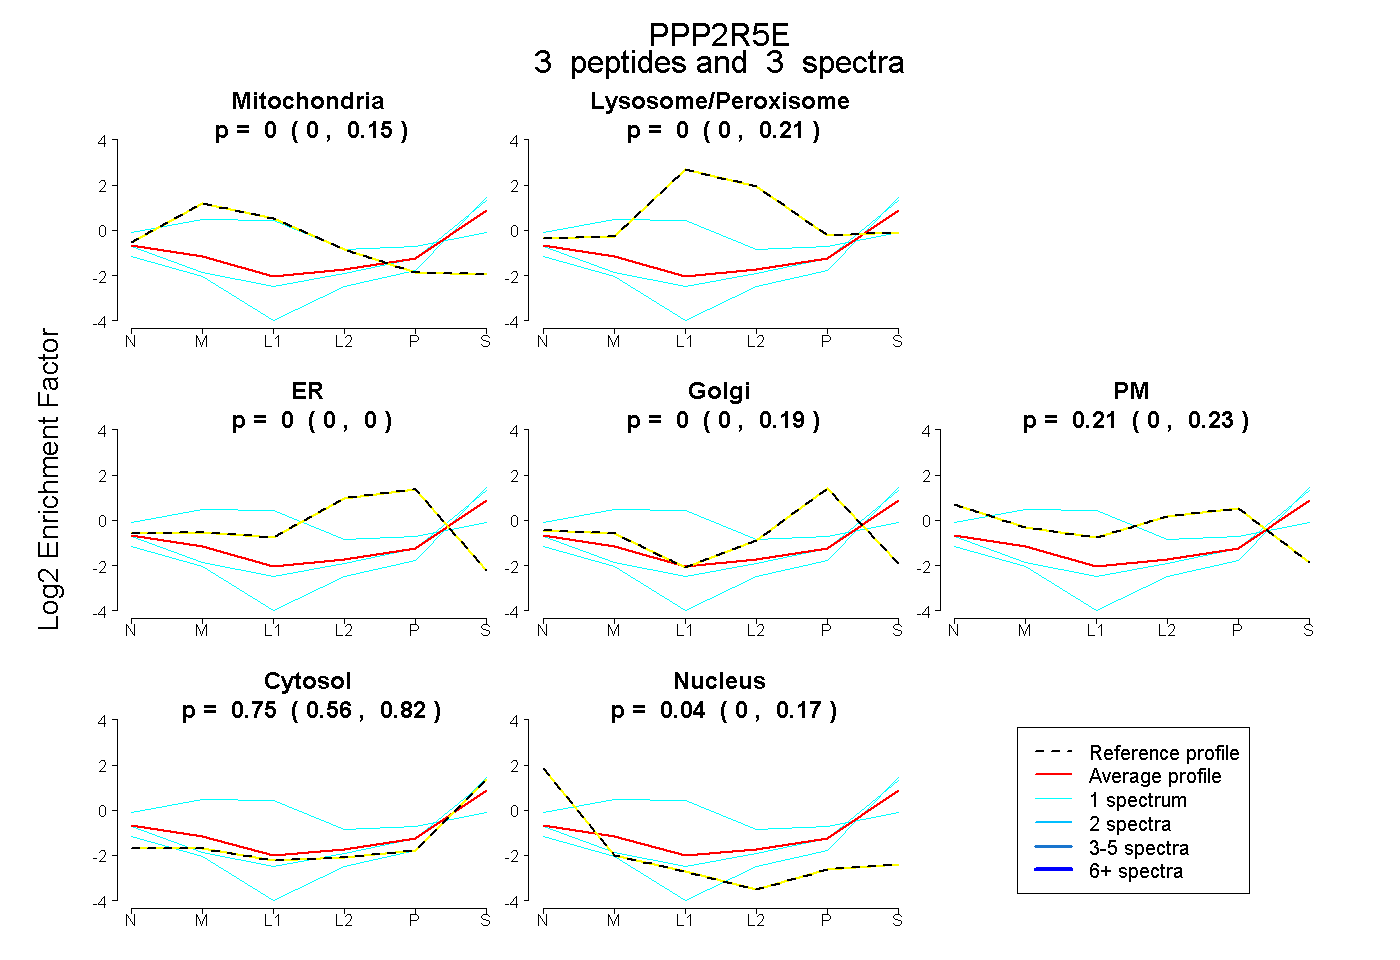 |
0.000 0.000 | 0.152 |
0.000 0.000 | 0.213 |
0.000 0.000 | 0.000 |
0.000 0.000 | 0.189 |
0.210 0.000 | 0.228 |
0.747 0.560 | 0.823 |
0.043 0.000 | 0.170 |
|||
| Plot | Lyso | Other | |||||||||||
| Expt C |
3 peptides |
7 spectra |
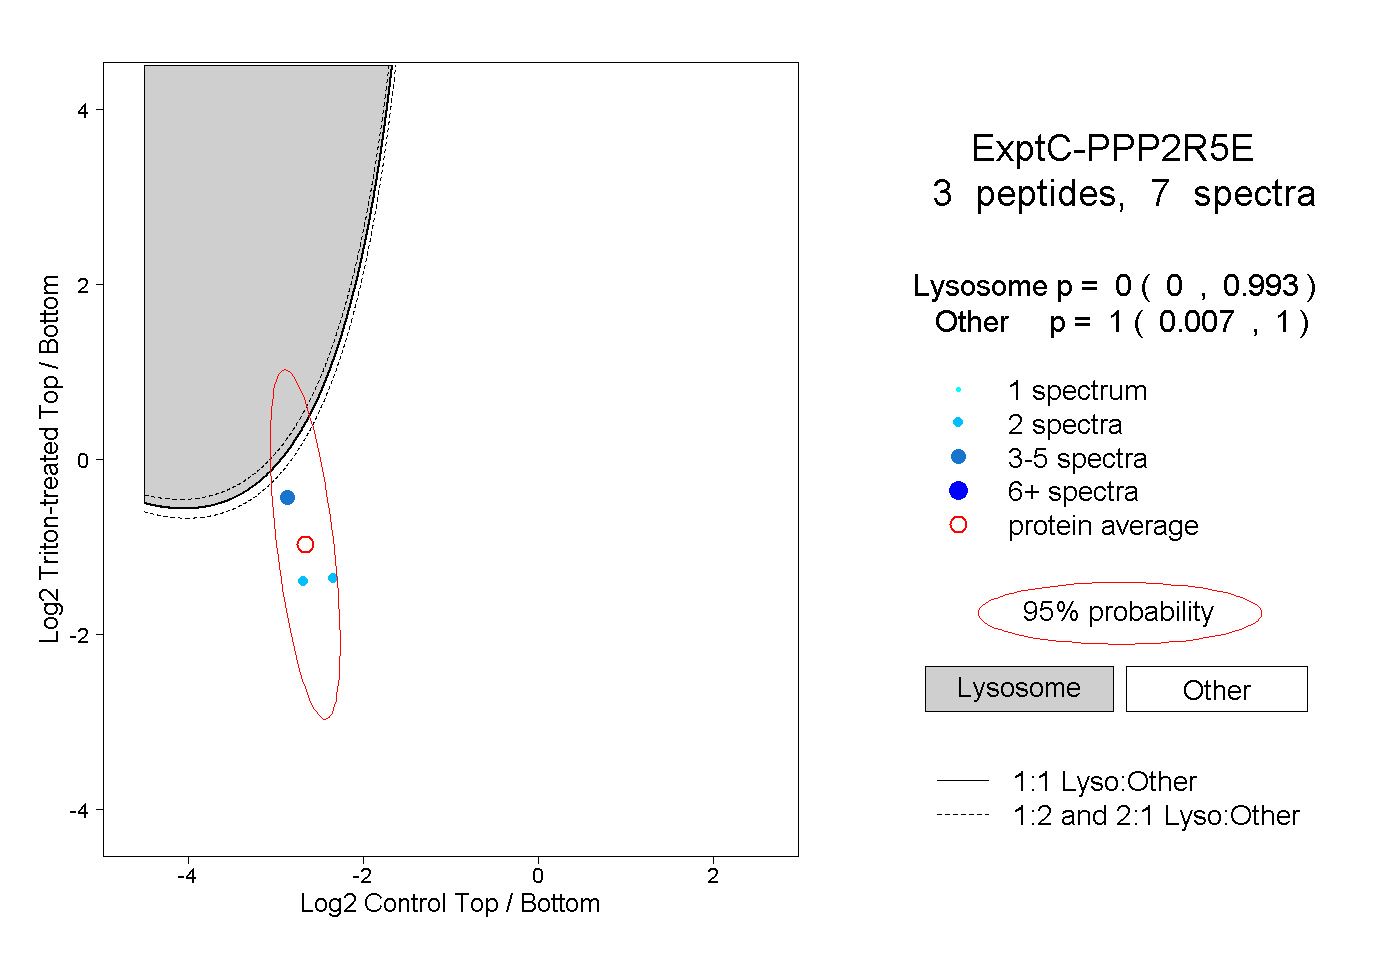 |
0.000 0.000 | 0.993 |
1.000 0.007 | 1.000 |