 19
19peptides
spectra
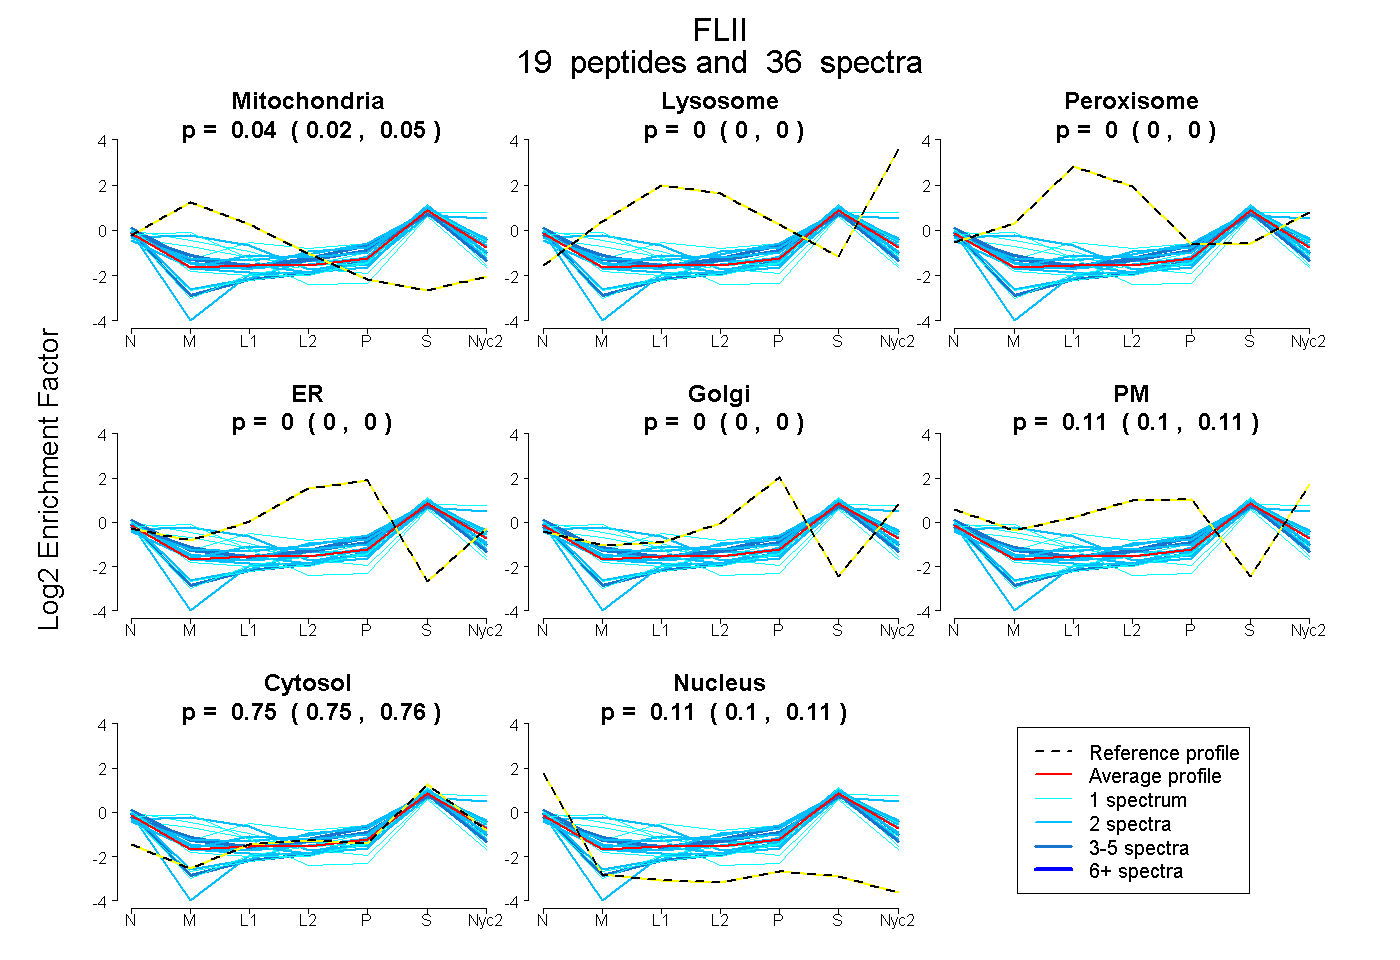
0.023 | 0.048
0.000 | 0.000
0.000 | 0.000
0.000 | 0.000
0.000 | 0.000
0.098 | 0.112
0.748 | 0.756
0.098 | 0.111
4peptides
spectra
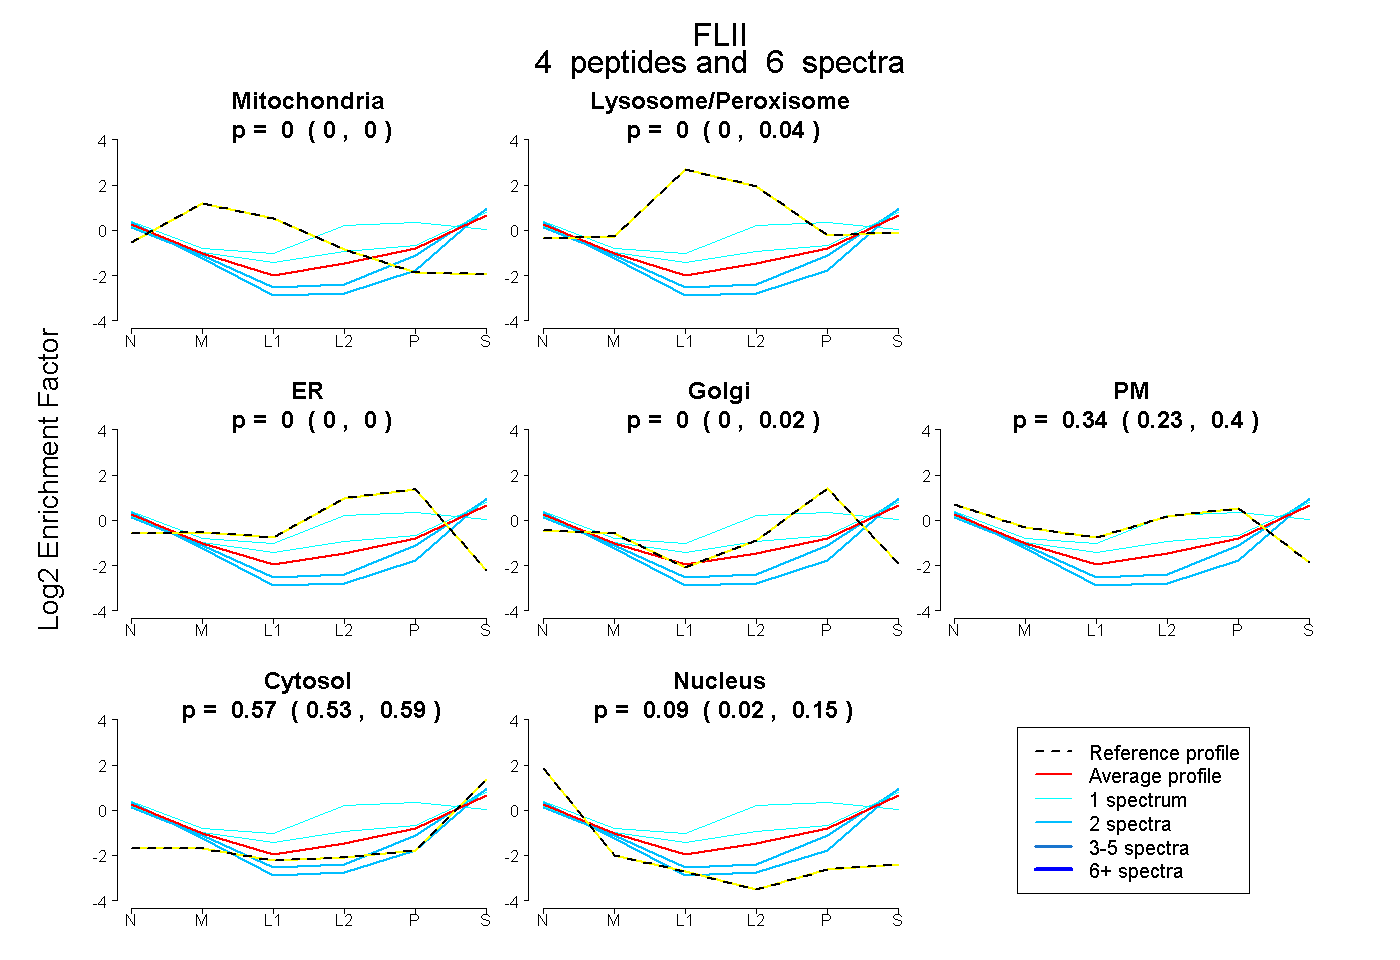
0.000 | 0.000
0.000 | 0.040
0.000 | 0.000
0.000 | 0.018
0.227 | 0.404
0.532 | 0.594
0.022 | 0.153
8peptides
spectra
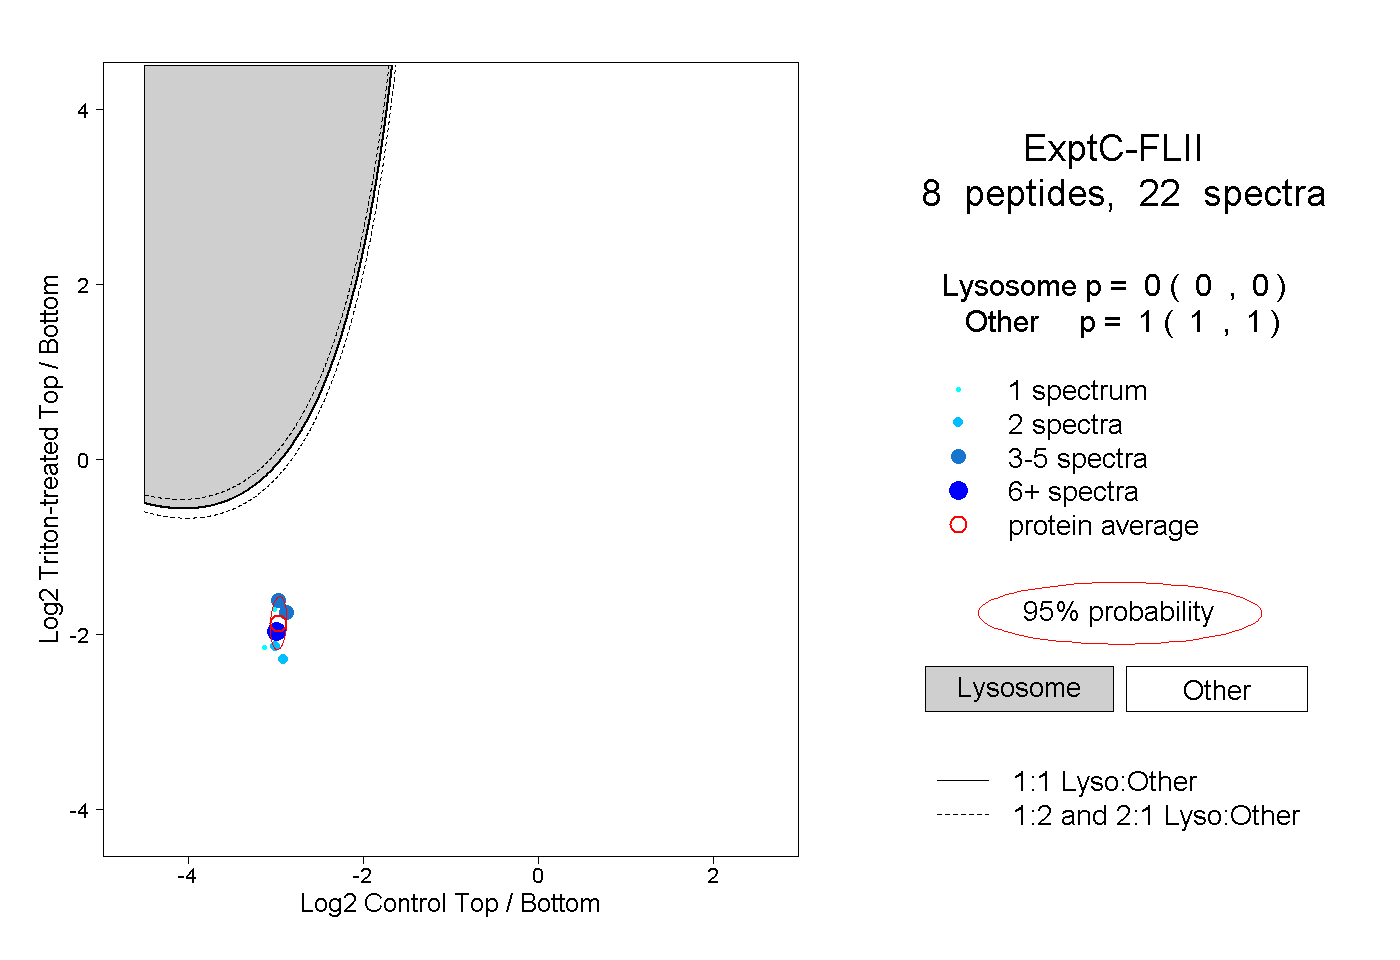
0.000 | 0.000
1.000 | 1.000