FLII
[ENSRNOP00000006753]
Main page
| | | Plot |
Mito |
Lyso |
|
Perox |
ER |
Golgi |
PM |
Cytosol |
Nucleus |
|
| Expt A |
 19
19
peptides |
36
spectra |
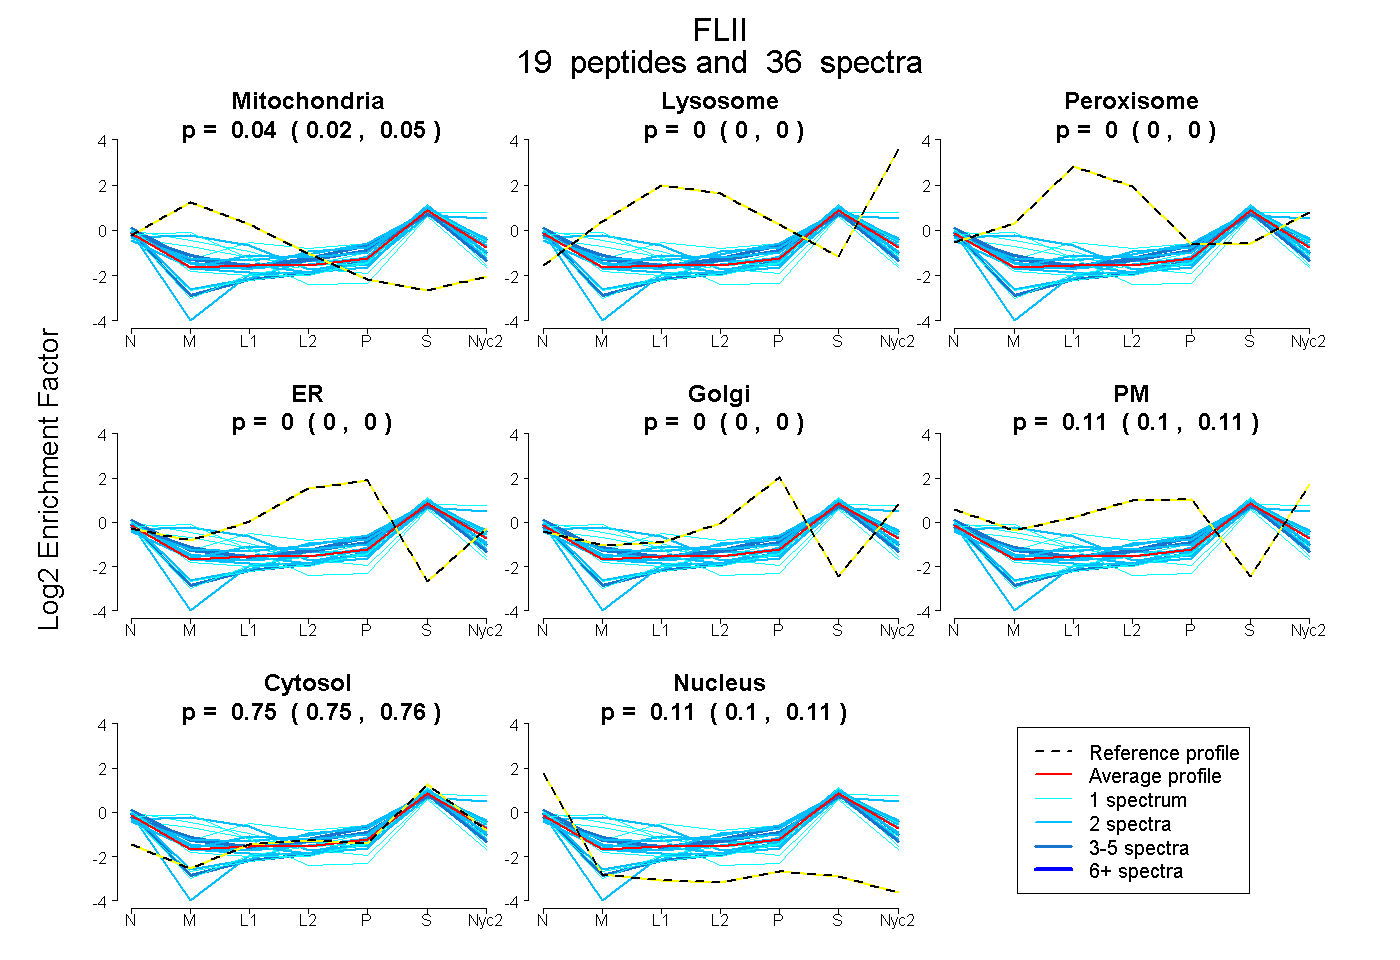 |
0.036
0.023 | 0.048 |
0.000
0.000 | 0.000 |
|
0.000
0.000 | 0.000 |
0.000
0.000 | 0.000 |
0.000
0.000 | 0.000 |
0.106
0.098 | 0.112 |
0.753
0.748 | 0.756 |
0.105
0.098 | 0.111 |
|
| | | Plot |
Mito |
|
Lyso or Perox |
|
ER |
Golgi |
PM |
Cytosol |
Nucleus |
|
| Expt B |
4
peptides |
6
spectra |
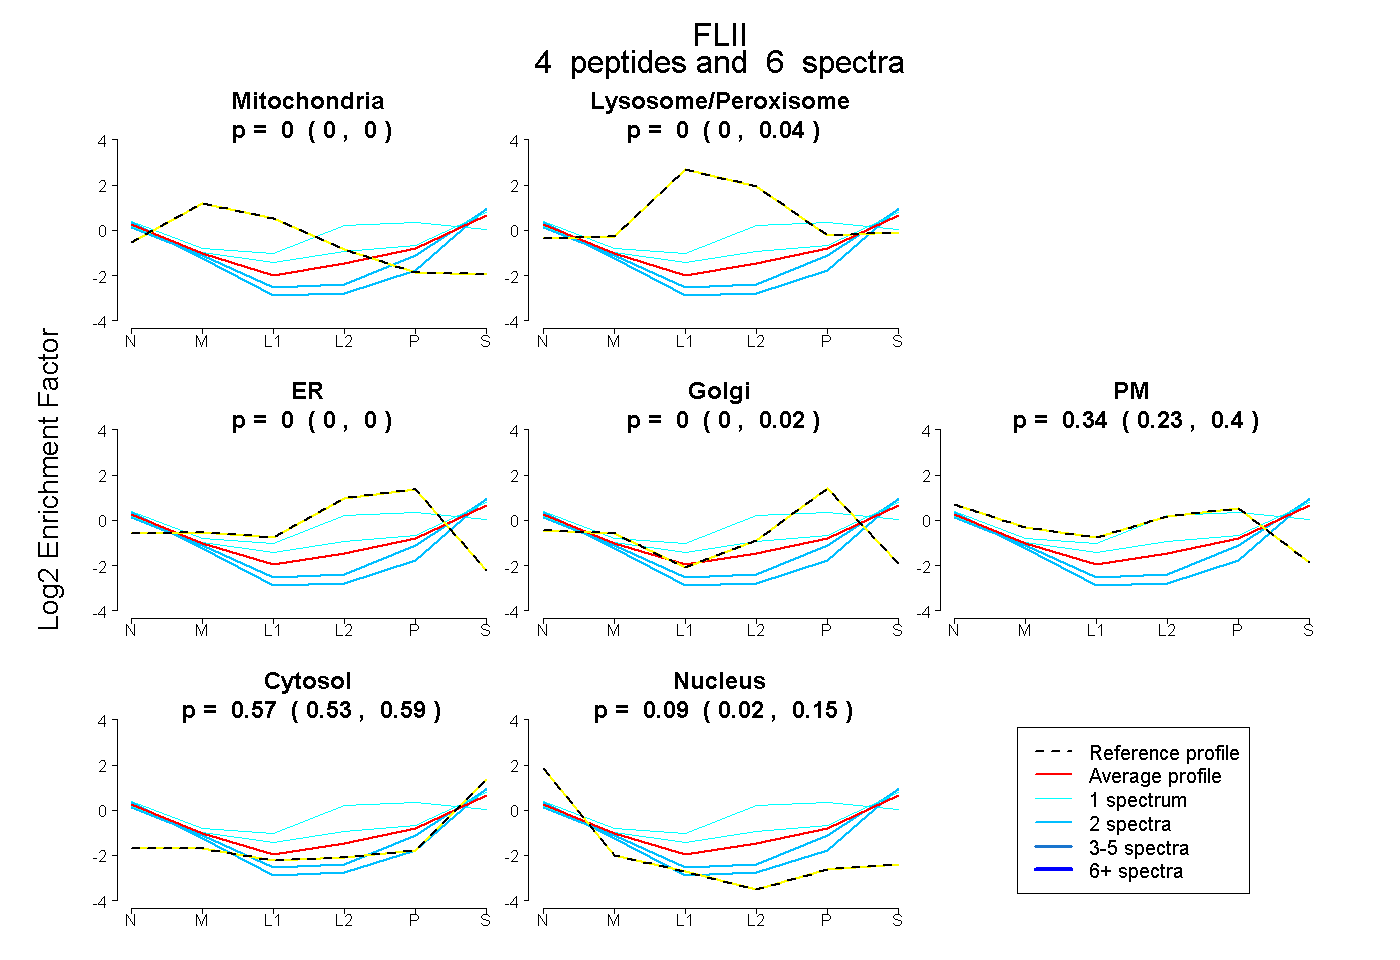 |
0.000
0.000 | 0.000 |
|
0.000
0.000 | 0.040 |
|
0.000
0.000 | 0.000 |
0.000
0.000 | 0.018 |
0.343
0.227 | 0.404 |
0.569
0.532 | 0.594 |
0.088
0.022 | 0.153 |
|
| | | Plot |
|
Lyso |
|
|
|
|
|
|
|
Other |
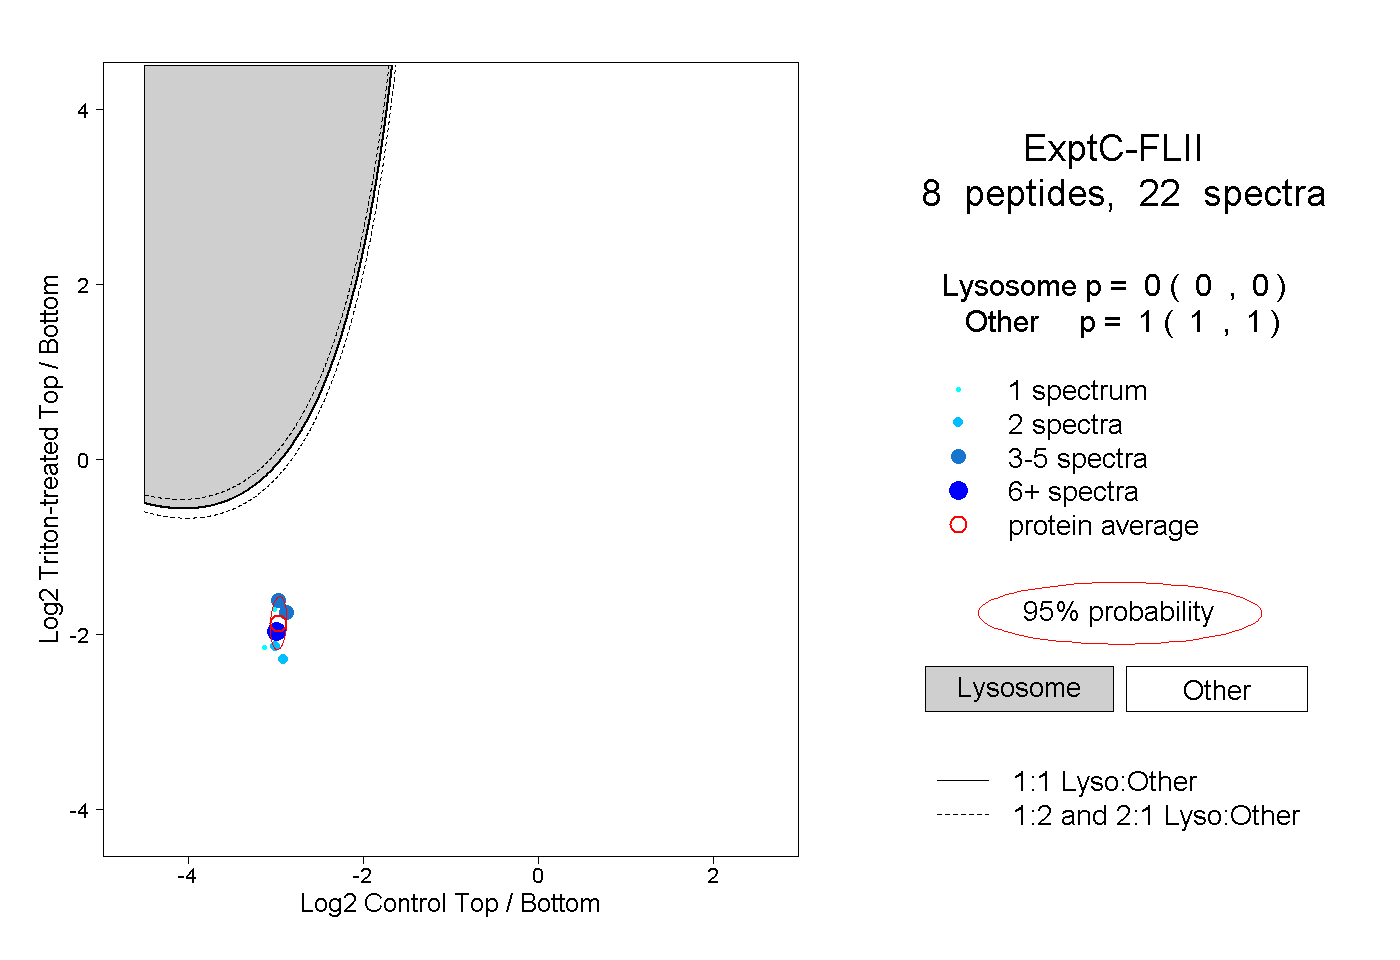
| Expt C |
8
peptides |
22
spectra |
 |
|
0.000
0.000 | 0.000 |
|
|
|
|
|
|
|
1.000
1.000 | 1.000 |
| 1 spectrum, LLQSLLDTR |
|
0.000 |
|
|
|
|
|
|
|
1.000 |
| 1 spectrum, GVDLSGNDFK |
|
0.000 |
|
|
|
|
|
|
|
1.000 |
| 2 spectra, NYLGAECR |
|
0.000 |
|
|
|
|
|
|
|
1.000 |
| 2 spectra, DSAQDVQAK |
|
0.000 |
|
|
|
|
|
|
|
1.000 |
| 6 spectra, ADLTALFLPR |
|
0.000 |
|
|
|
|
|
|
|
1.000 |
| 4 spectra, GTSLDPR |
|
0.000 |
|
|
|
|
|
|
|
1.000 |
| 4 spectra, ASDPDEAK |
|
0.000 |
|
|
|
|
|
|
|
1.000 |
| 2 spectra, GAQATLSNTTK |
|
0.000 |
|
|
|
|
|
|
|
1.000 |