 8
8peptides
spectra
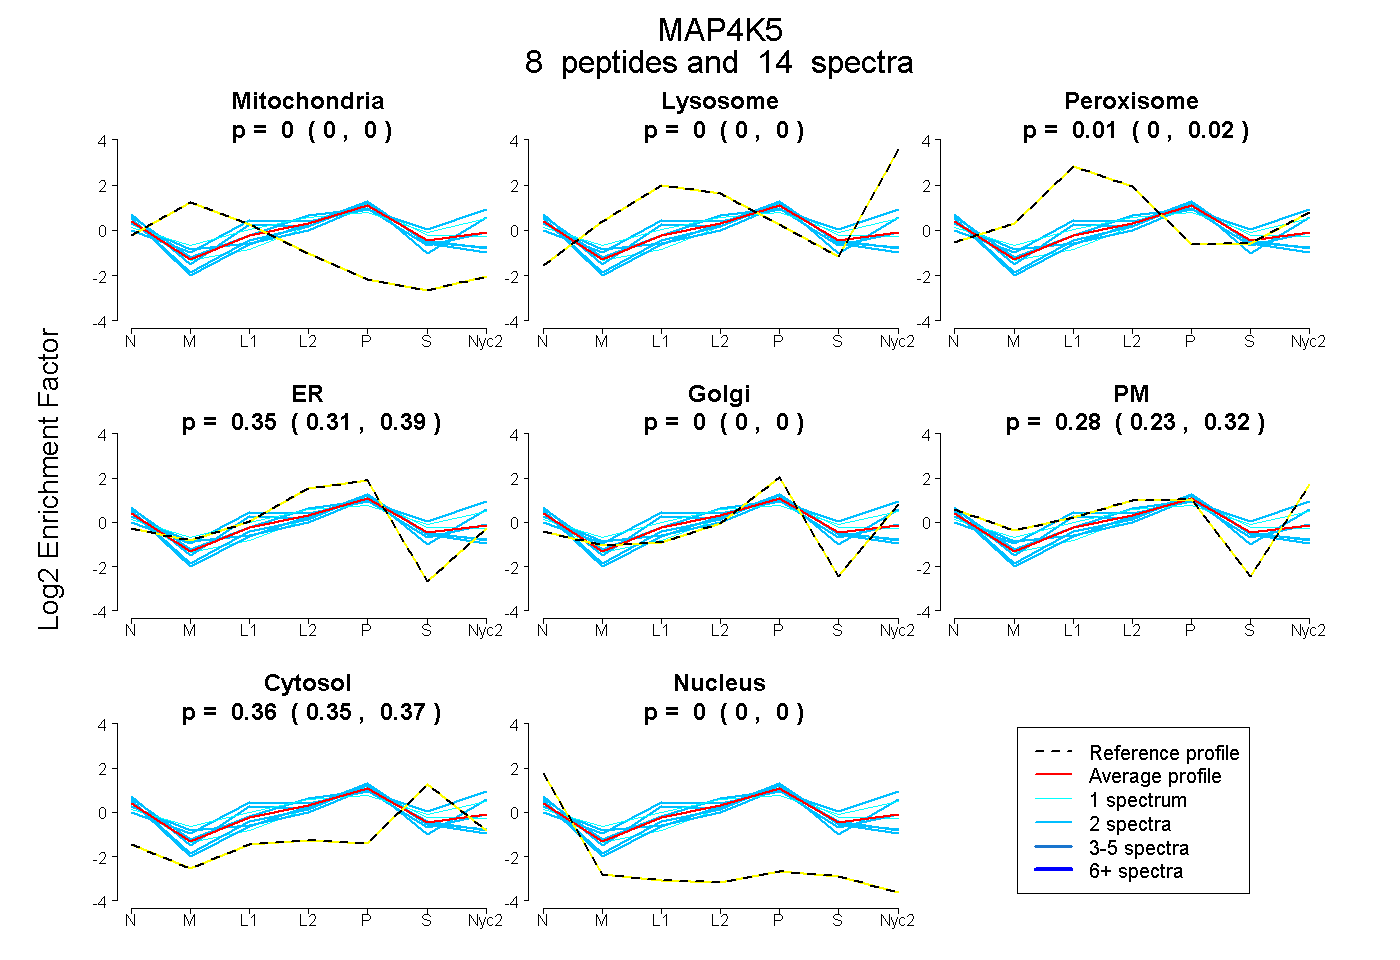
0.000 | 0.000
0.000 | 0.000
0.000 | 0.022
0.307 | 0.387
0.000 | 0.000
0.233 | 0.324
0.348 | 0.367
0.000 | 0.000
1peptide
spectrum
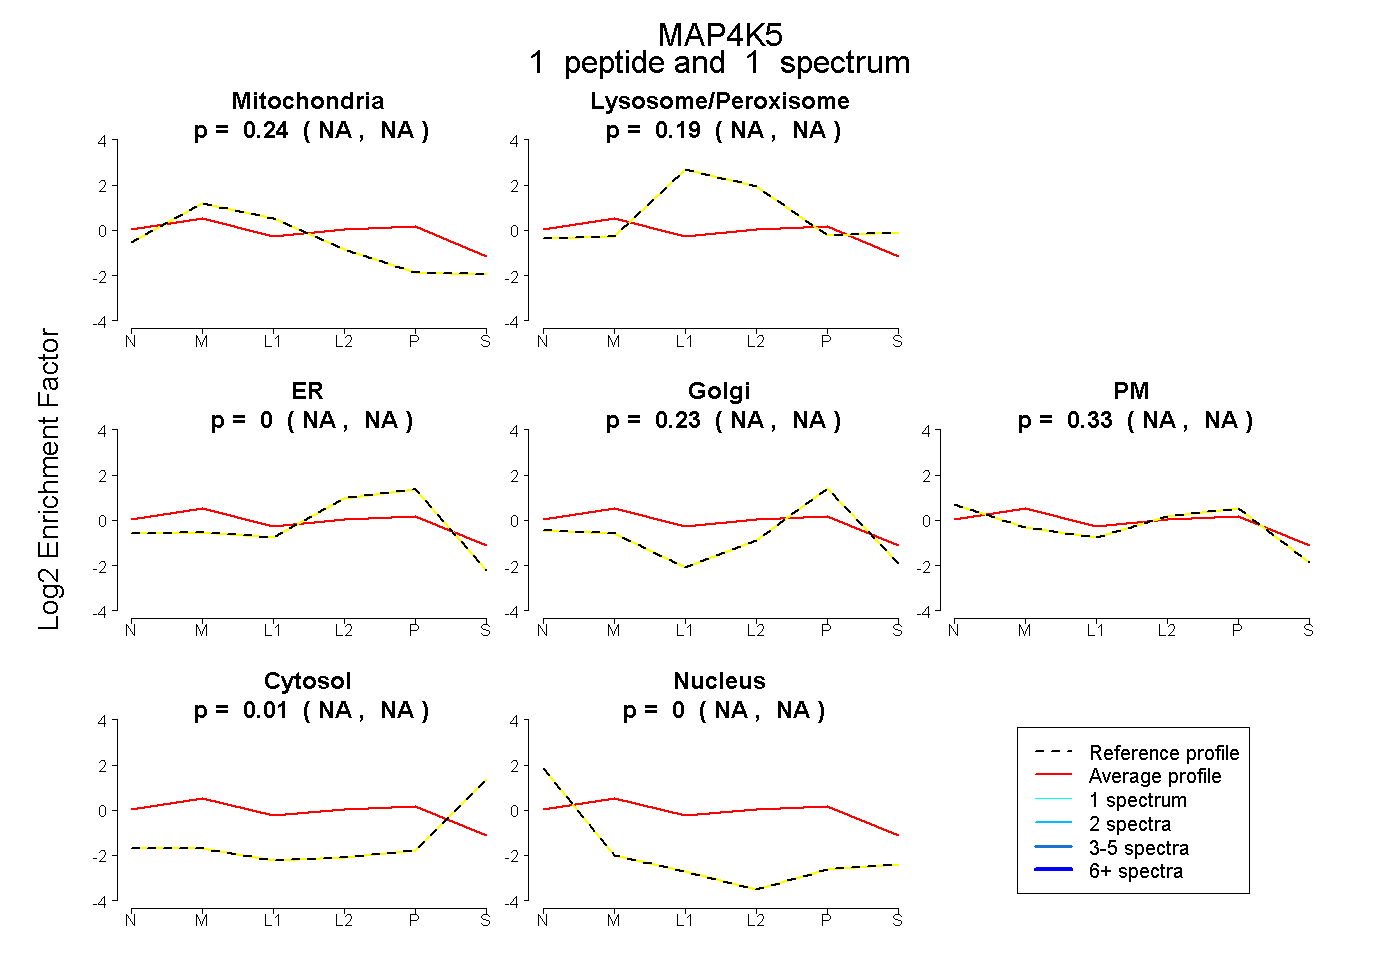
NA | NA
NA | NA
NA | NA
NA | NA
NA | NA
NA | NA
NA | NA
4peptides
spectra
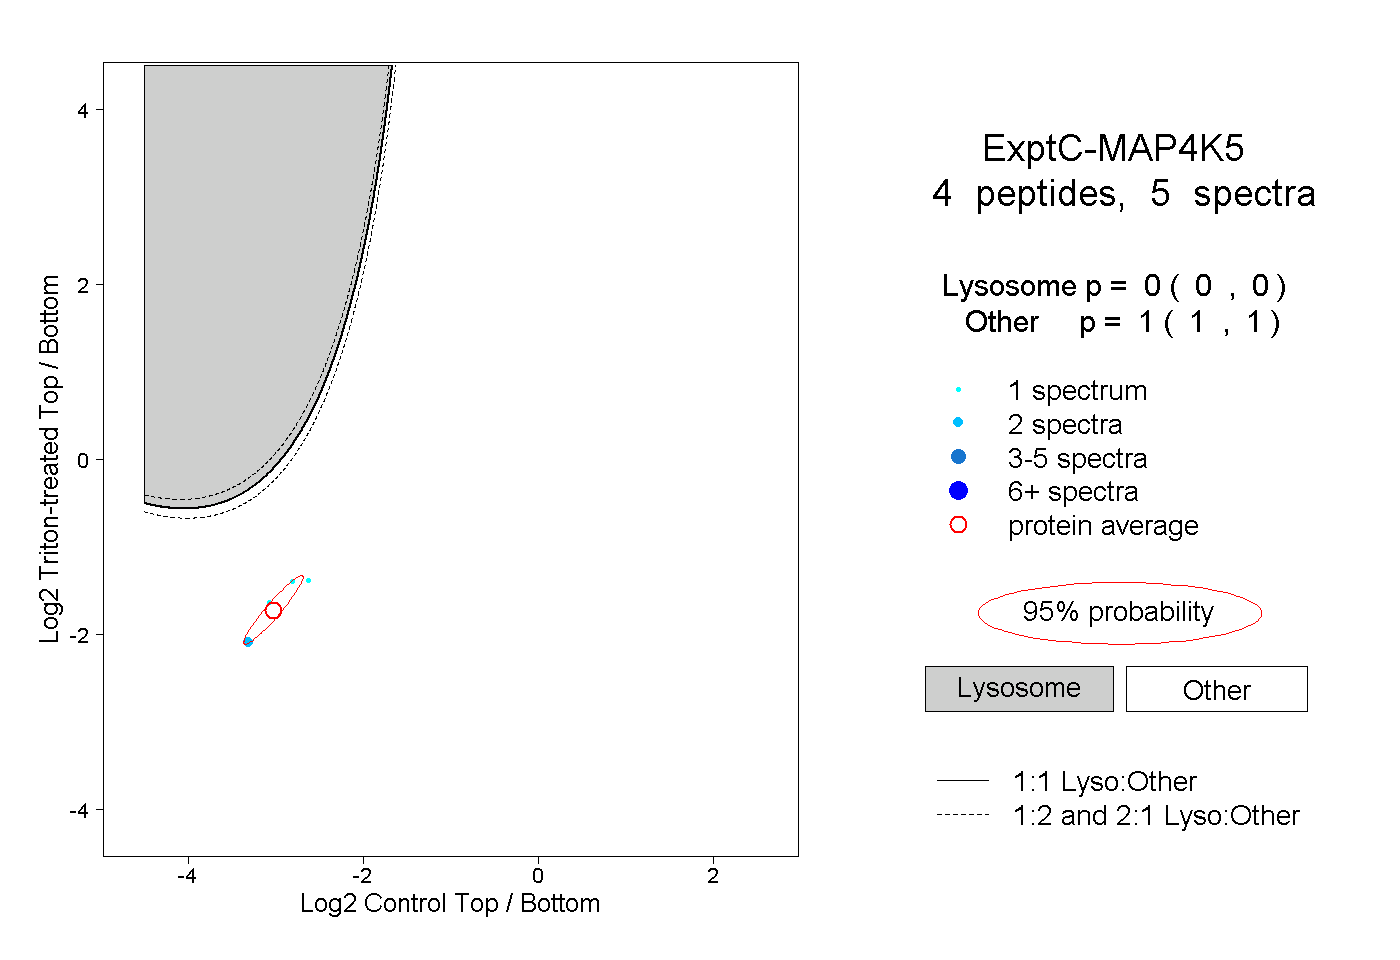
0.000 | 0.000
1.000 | 1.000