 8
8peptides
spectra
0.000 | 0.000
0.000 | 0.000
0.000 | 0.022
0.307 | 0.387
0.000 | 0.000
0.233 | 0.324
0.348 | 0.367
0.000 | 0.000
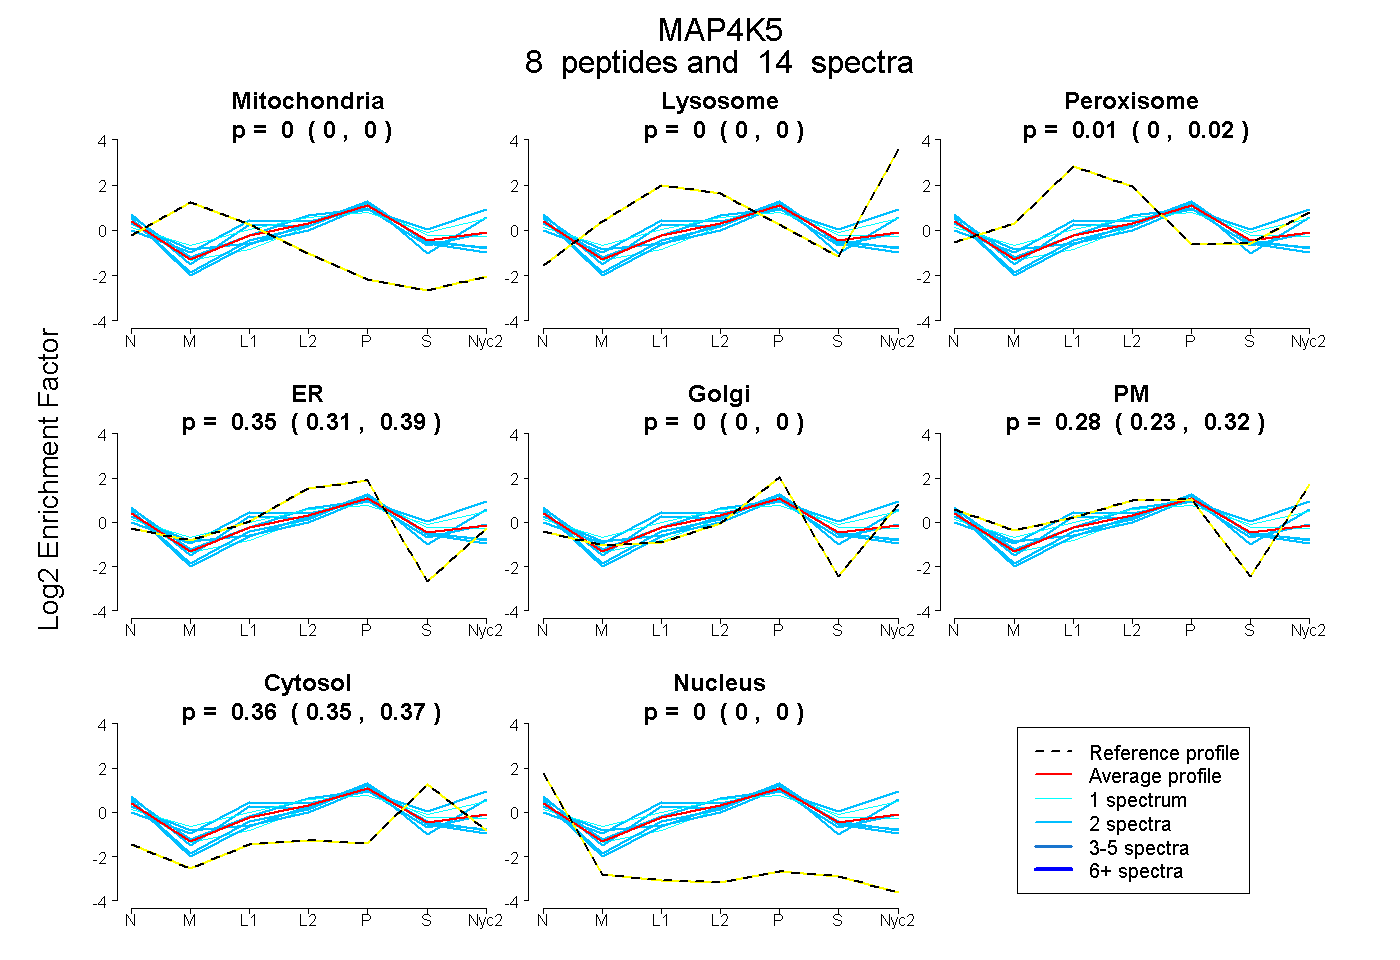
| Plot | Mito | Lyso | Perox | ER | Golgi | PM | Cytosol | Nucleus | |||||
| Expt A |
8 peptides |
14 spectra |
|
0.000 0.000 | 0.000 |
0.000 0.000 | 0.000 |
0.006 0.000 | 0.022 |
0.351 0.307 | 0.387 |
0.000 0.000 | 0.000 |
0.285 0.233 | 0.324 |
0.359 0.348 | 0.367 |
0.000 0.000 | 0.000 |
| 1 spectrum, NVHTGELAAVK | 0.000 | 0.000 | 0.214 | 0.053 | 0.105 | 0.332 | 0.296 | 0.000 | ||
| 2 spectra, GANILLTDHGDVK | 0.000 | 0.000 | 0.000 | 0.595 | 0.000 | 0.000 | 0.341 | 0.064 | ||
| 2 spectra, NPYTGHK | 0.005 | 0.000 | 0.042 | 0.443 | 0.106 | 0.024 | 0.334 | 0.046 | ||
| 2 spectra, LLTHTFVGQSGLSR | 0.000 | 0.000 | 0.000 | 0.149 | 0.044 | 0.550 | 0.257 | 0.000 | ||
| 1 spectrum, ALAVELLDK | 0.000 | 0.000 | 0.000 | 0.324 | 0.137 | 0.141 | 0.398 | 0.000 | ||
| 2 spectra, ALFLMSK | 0.000 | 0.000 | 0.038 | 0.359 | 0.000 | 0.300 | 0.292 | 0.011 | ||
| 2 spectra, LADFGVAAK | 0.000 | 0.065 | 0.238 | 0.000 | 0.203 | 0.226 | 0.269 | 0.000 | ||
| 2 spectra, SDEVTQEISDETR | 0.000 | 0.000 | 0.000 | 0.558 | 0.042 | 0.000 | 0.354 | 0.046 |
| Plot | Mito | Lyso or Perox | ER | Golgi | PM | Cytosol | Nucleus | ||||||
| Expt B |
1 peptide |
1 spectrum |
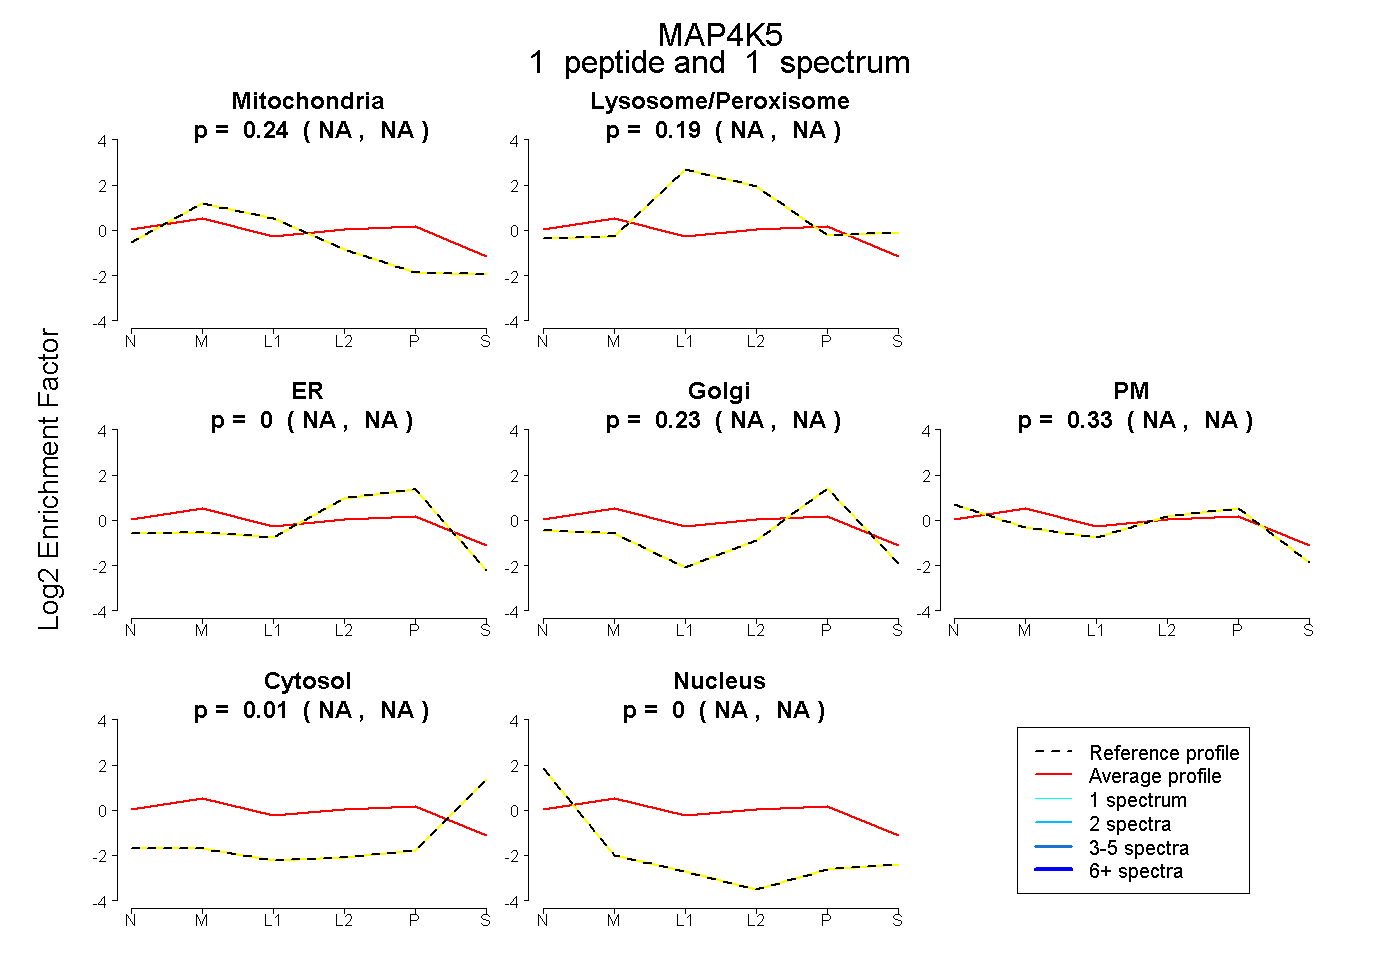 |
0.237 NA | NA |
0.193 NA | NA |
0.000 NA | NA |
0.227 NA | NA |
0.333 NA | NA |
0.010 NA | NA |
0.000 NA | NA |
|||
| Plot | Lyso | Other | |||||||||||
| Expt C |
4 peptides |
5 spectra |
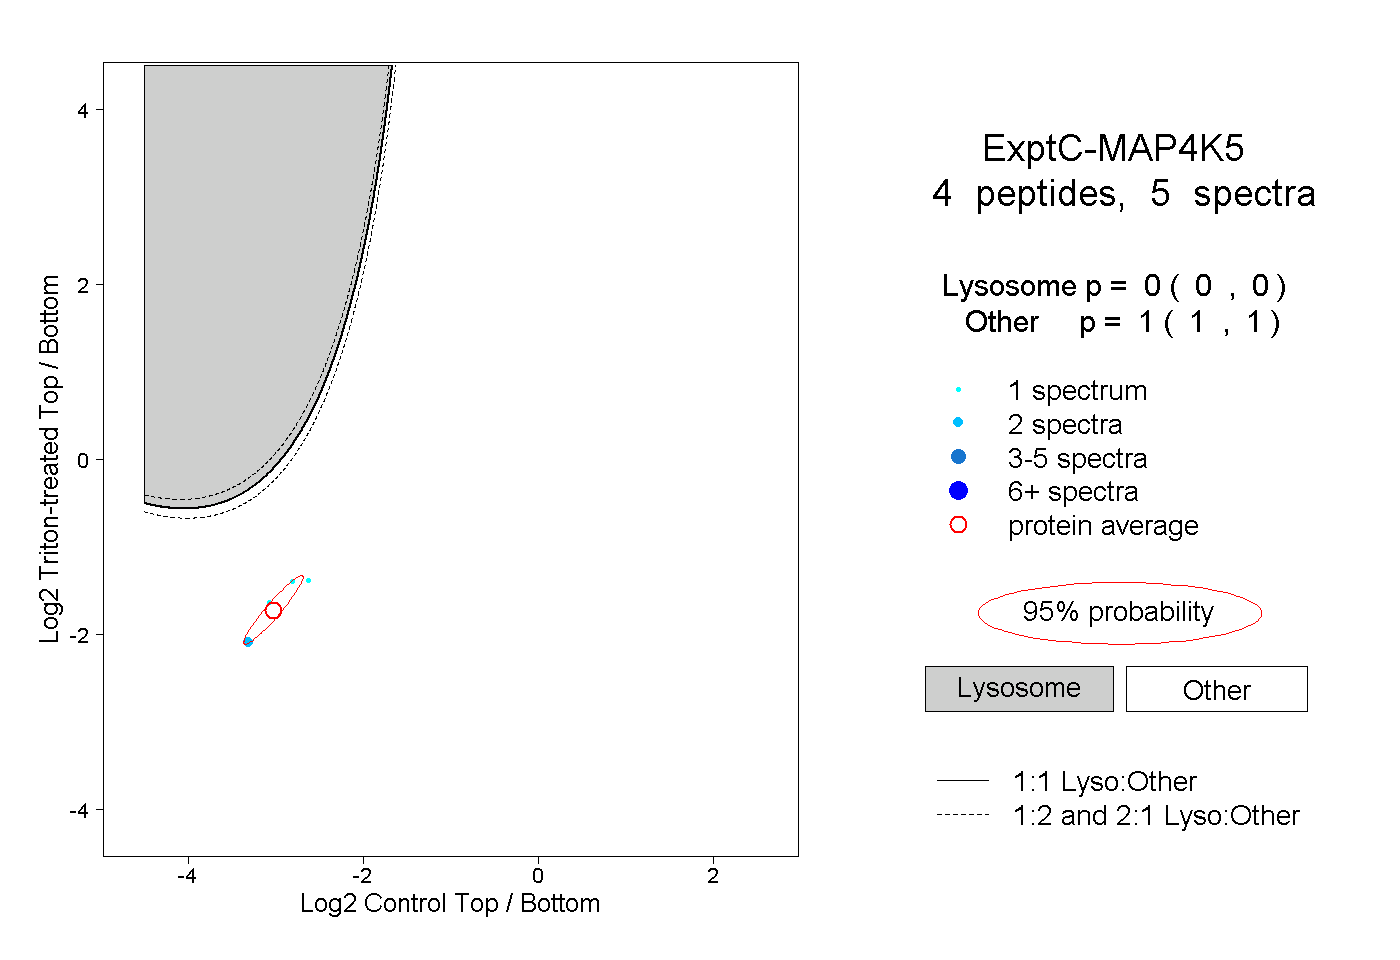 |
0.000 0.000 | 0.000 |
1.000 1.000 | 1.000 |