 9
9peptides
spectra
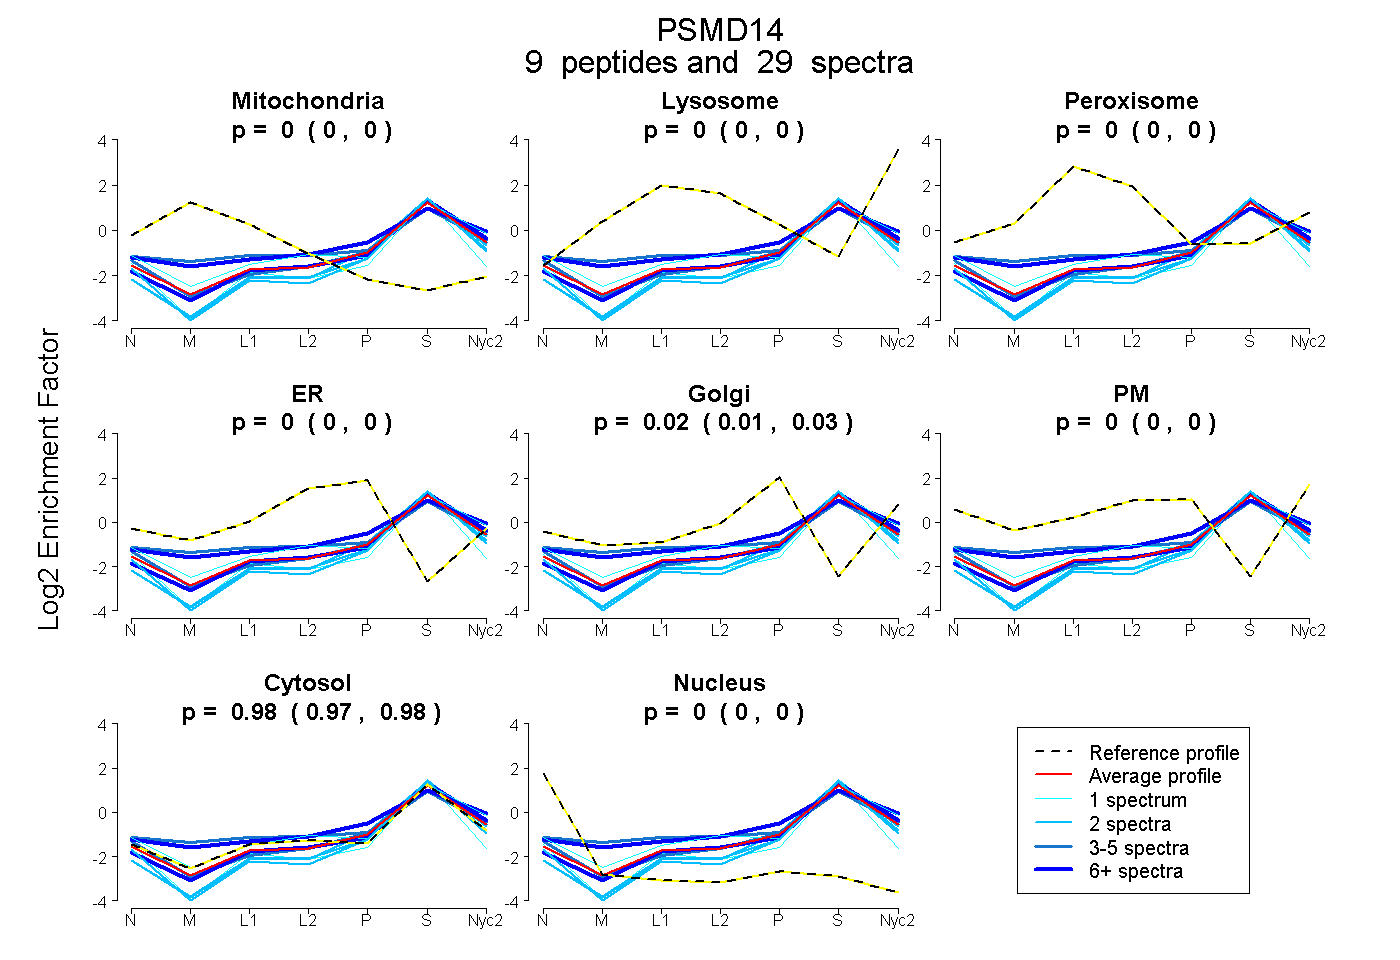
0.000 | 0.000
0.000 | 0.000
0.000 | 0.000
0.000 | 0.000
0.015 | 0.031
0.000 | 0.000
0.968 | 0.984
0.000 | 0.000
4peptides
spectra
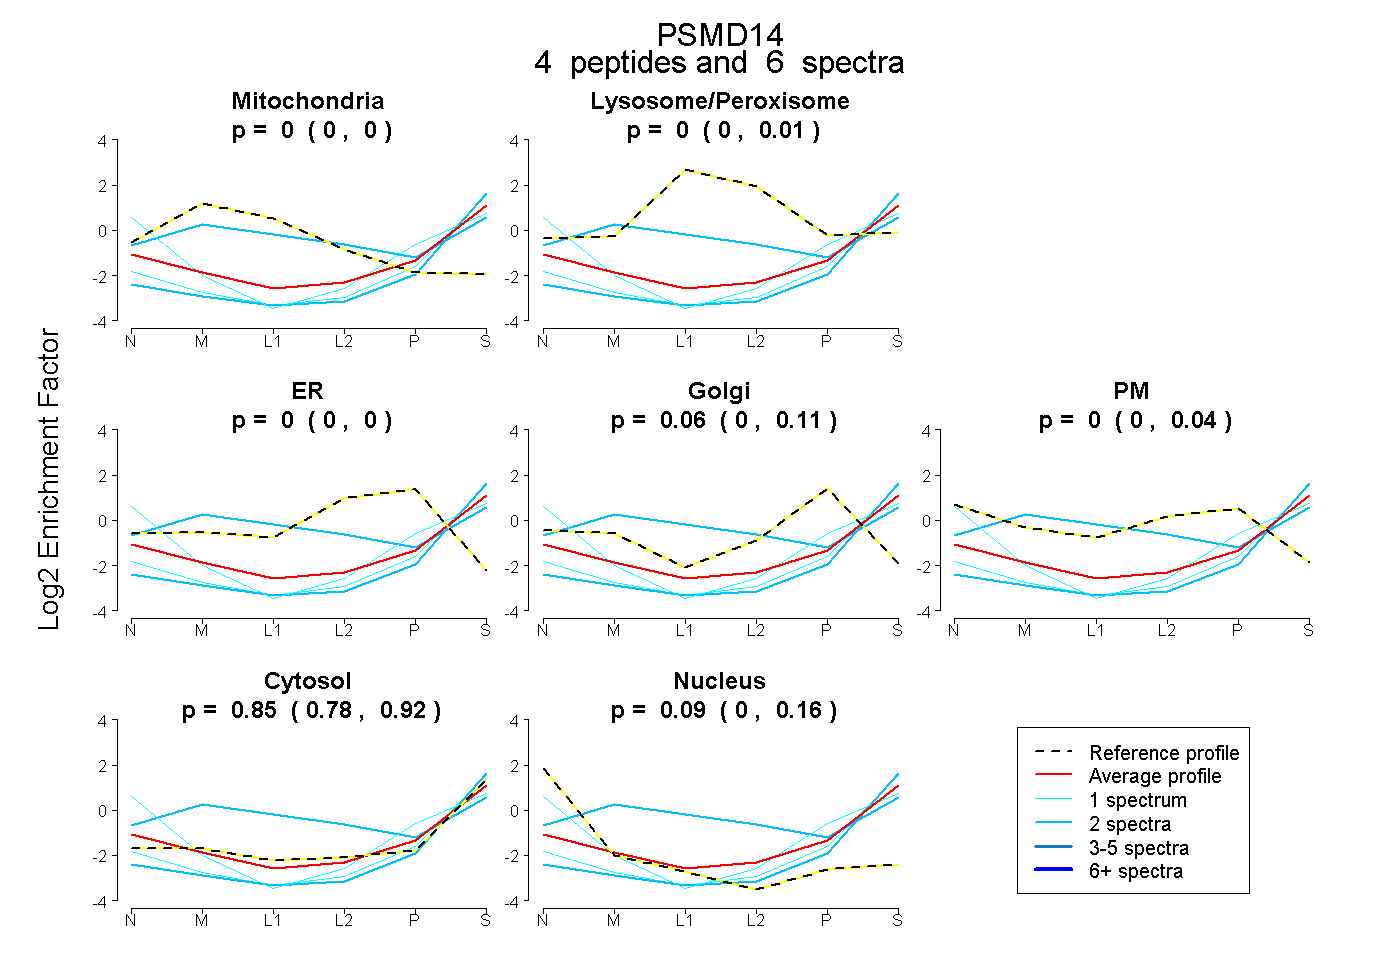
0.000 | 0.000
0.000 | 0.008
0.000 | 0.000
0.000 | 0.108
0.000 | 0.038
0.778 | 0.917
0.002 | 0.159
6peptides
spectra
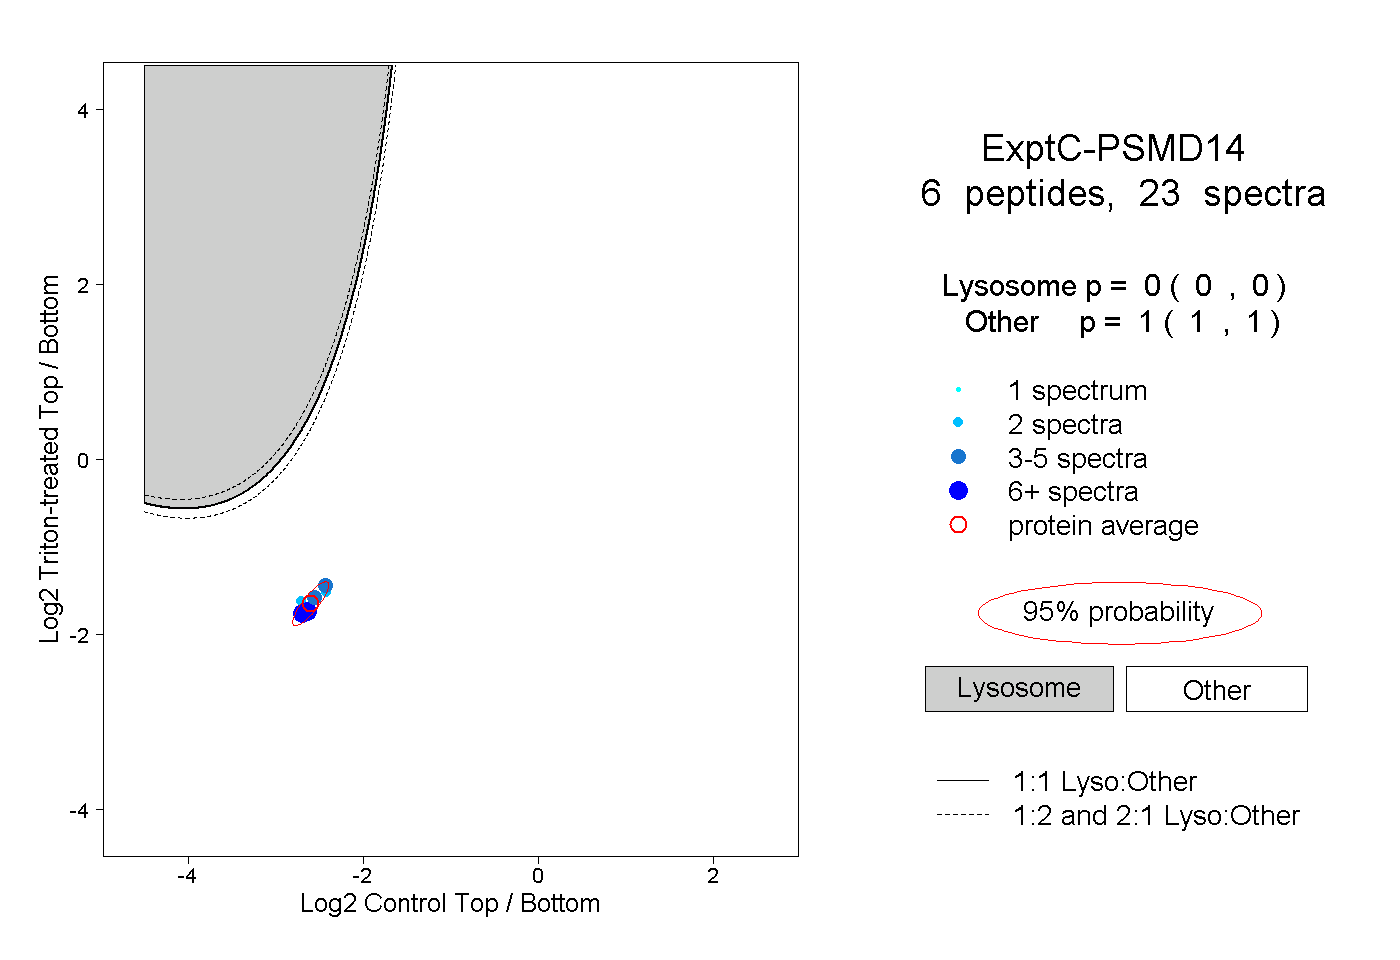
0.000 | 0.000
1.000 | 1.000