 9
9peptides
spectra
0.000 | 0.000
0.000 | 0.000
0.000 | 0.000
0.000 | 0.000
0.015 | 0.031
0.000 | 0.000
0.968 | 0.984
0.000 | 0.000
| Plot | Mito | Lyso | Perox | ER | Golgi | PM | Cytosol | Nucleus | |||||
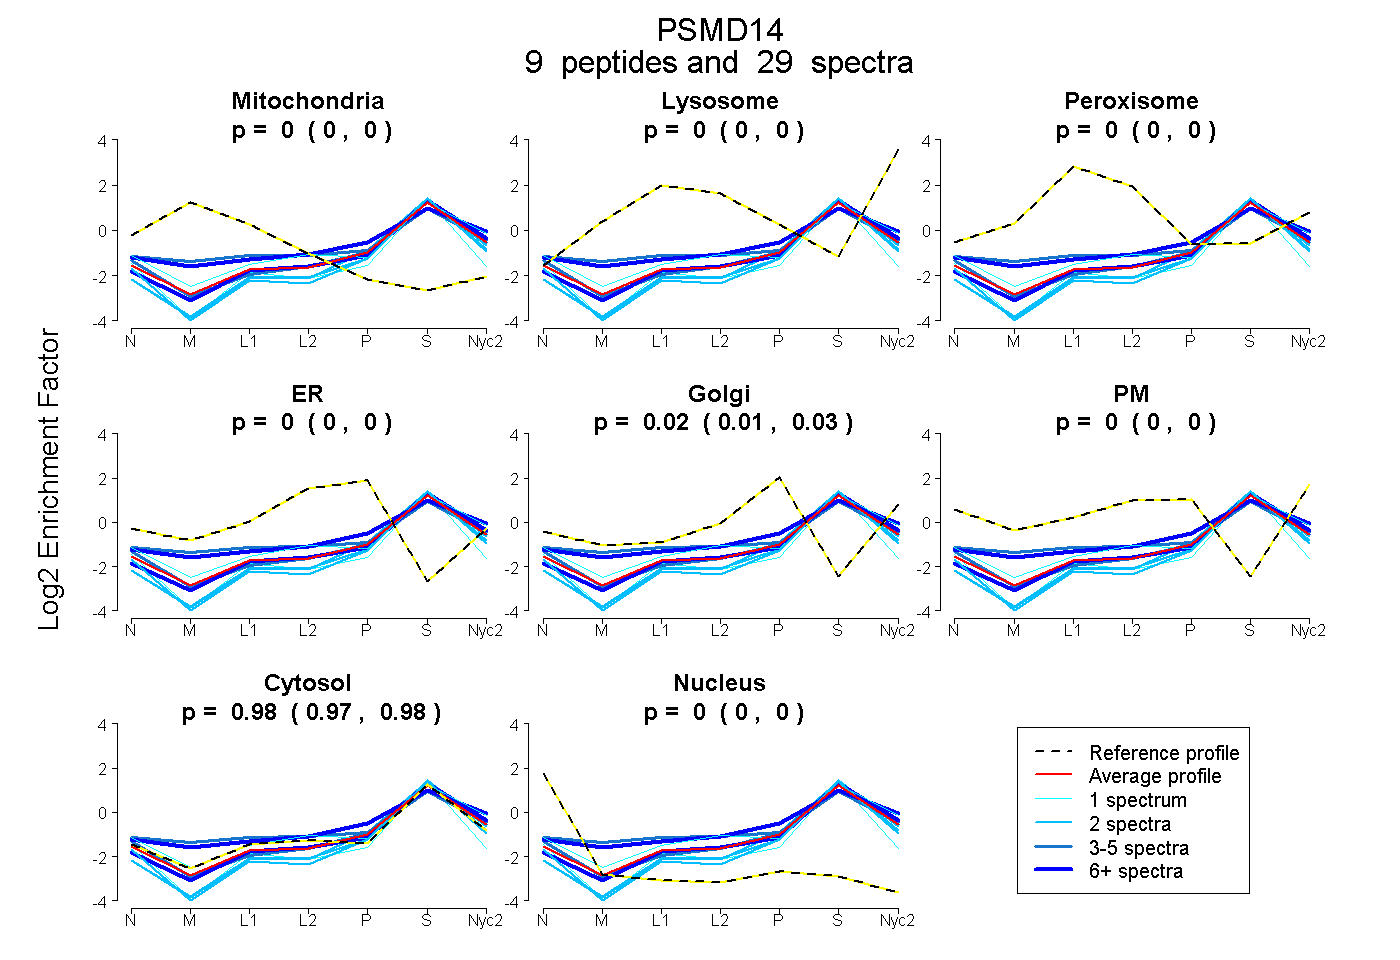
| Expt A |
9 peptides |
29 spectra |
|
0.000 0.000 | 0.000 |
0.000 0.000 | 0.000 |
0.000 0.000 | 0.000 |
0.000 0.000 | 0.000 |
0.023 0.015 | 0.031 |
0.000 0.000 | 0.000 |
0.977 0.968 | 0.984 |
0.000 0.000 | 0.000 |
| 2 spectra, MLDMLK | 0.000 | 0.000 | 0.000 | 0.000 | 0.000 | 0.000 | 1.000 | 0.000 | ||
| 1 spectrum, NELEQK | 0.000 | 0.040 | 0.000 | 0.000 | 0.000 | 0.040 | 0.920 | 0.000 | ||
| 2 spectra, VVIDAFR | 0.000 | 0.000 | 0.000 | 0.000 | 0.000 | 0.000 | 0.943 | 0.057 | ||
| 7 spectra, MLLNLHK | 0.000 | 0.000 | 0.000 | 0.000 | 0.000 | 0.000 | 1.000 | 0.000 | ||
| 6 spectra, LINANMMVLGHEPR | 0.000 | 0.094 | 0.000 | 0.000 | 0.130 | 0.000 | 0.776 | 0.000 | ||
| 2 spectra, AVEEEDK | 0.000 | 0.000 | 0.000 | 0.000 | 0.000 | 0.000 | 1.000 | 0.000 | ||
| 1 spectrum, AVAVVVDPIQSVK | 0.000 | 0.000 | 0.000 | 0.000 | 0.000 | 0.000 | 0.896 | 0.104 | ||
| 3 spectra, HNESVVK | 0.000 | 0.000 | 0.000 | 0.000 | 0.018 | 0.000 | 0.973 | 0.010 | ||
| 5 spectra, EMLELAK | 0.084 | 0.089 | 0.000 | 0.000 | 0.048 | 0.000 | 0.780 | 0.000 |
| Plot | Mito | Lyso or Perox | ER | Golgi | PM | Cytosol | Nucleus | ||||||
| Expt B |
4 peptides |
6 spectra |
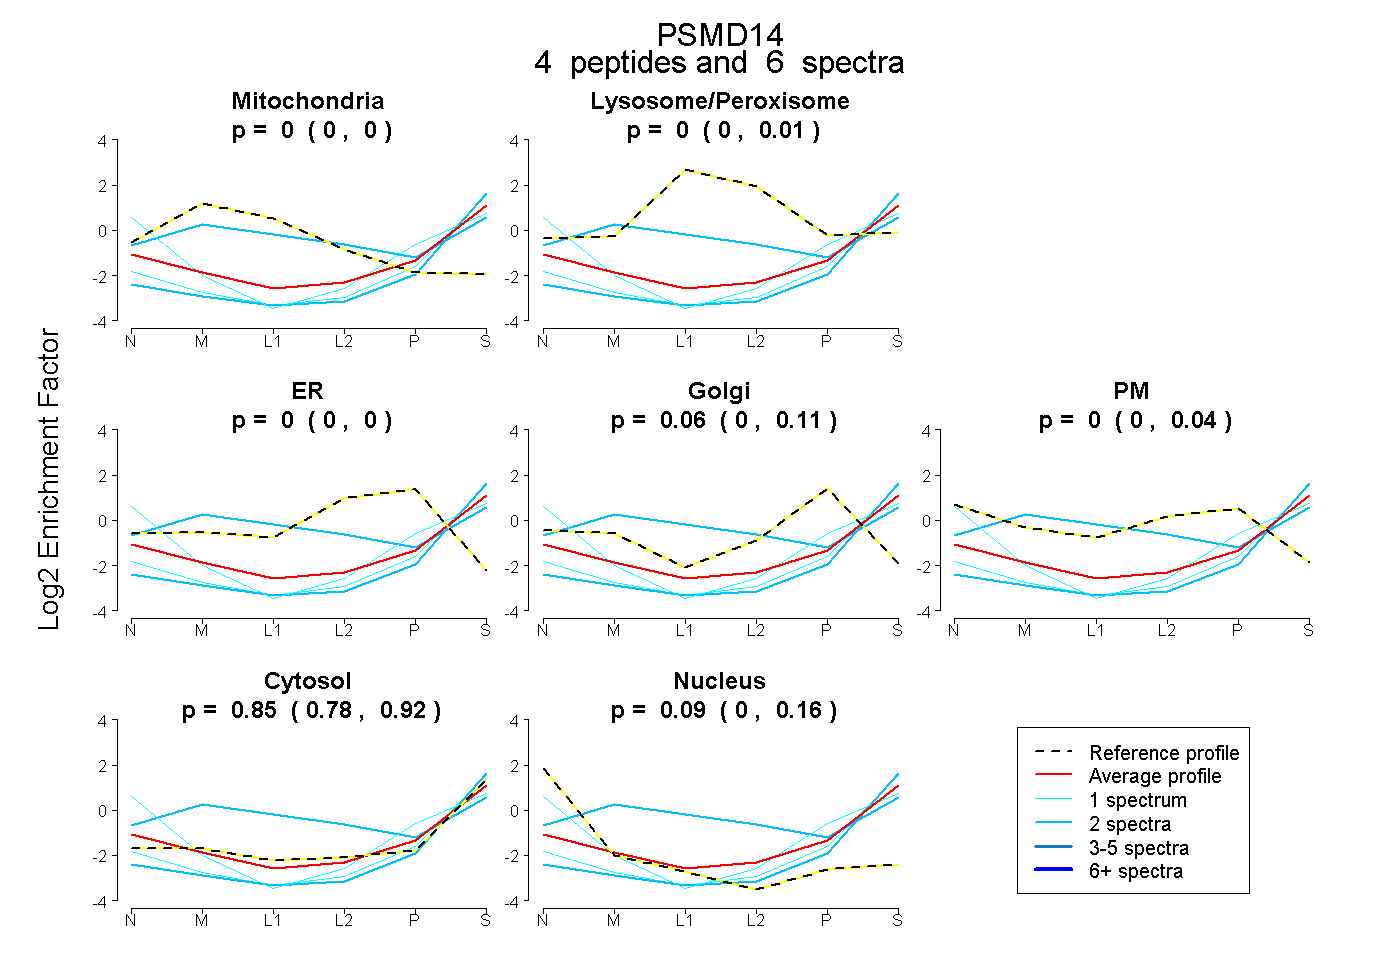 |
0.000 0.000 | 0.000 |
0.000 0.000 | 0.008 |
0.000 0.000 | 0.000 |
0.056 0.000 | 0.108 |
0.000 0.000 | 0.038 |
0.853 0.778 | 0.917 |
0.091 0.002 | 0.159 |
|||
| Plot | Lyso | Other | |||||||||||
| Expt C |
6 peptides |
23 spectra |
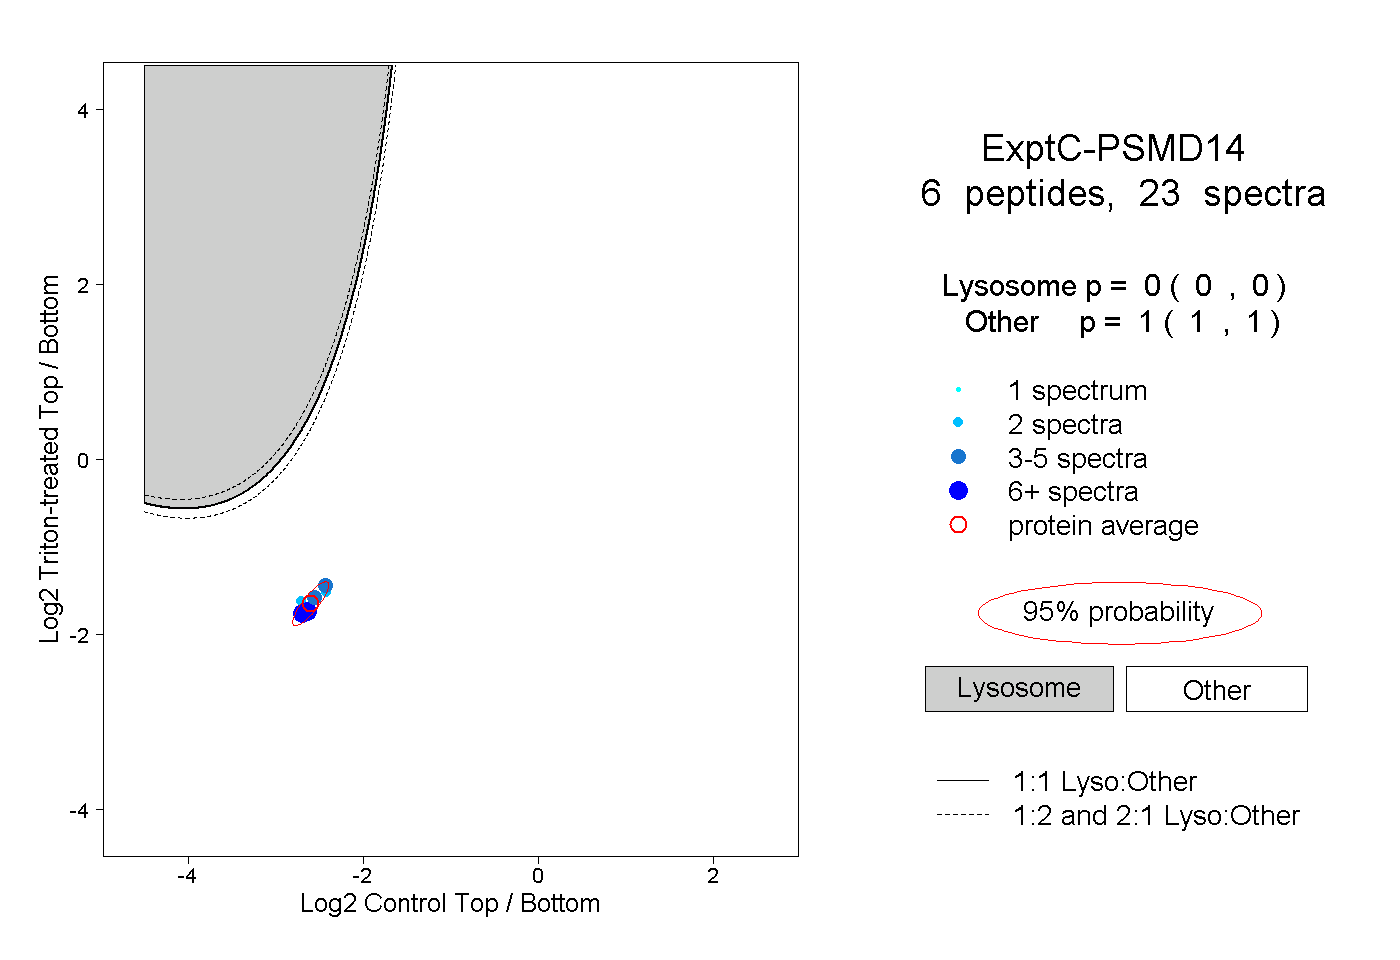 |
0.000 0.000 | 0.000 |
1.000 1.000 | 1.000 |