 13
13peptides
spectra
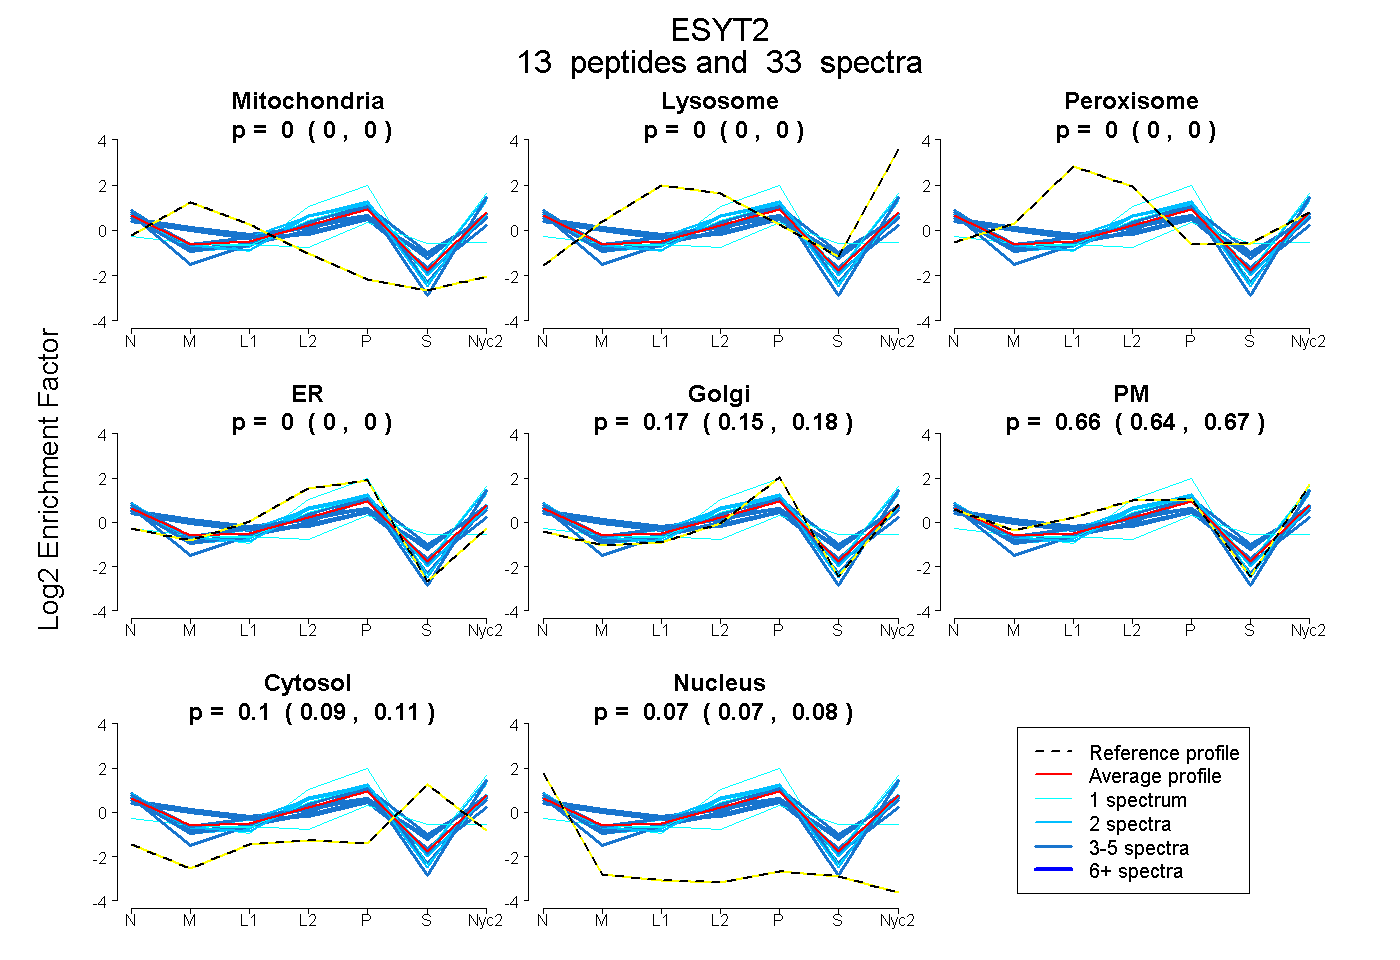
0.000 | 0.004
0.000 | 0.000
0.000 | 0.000
0.000 | 0.003
0.150 | 0.179
0.644 | 0.669
0.090 | 0.112
0.066 | 0.079
5peptides
spectra
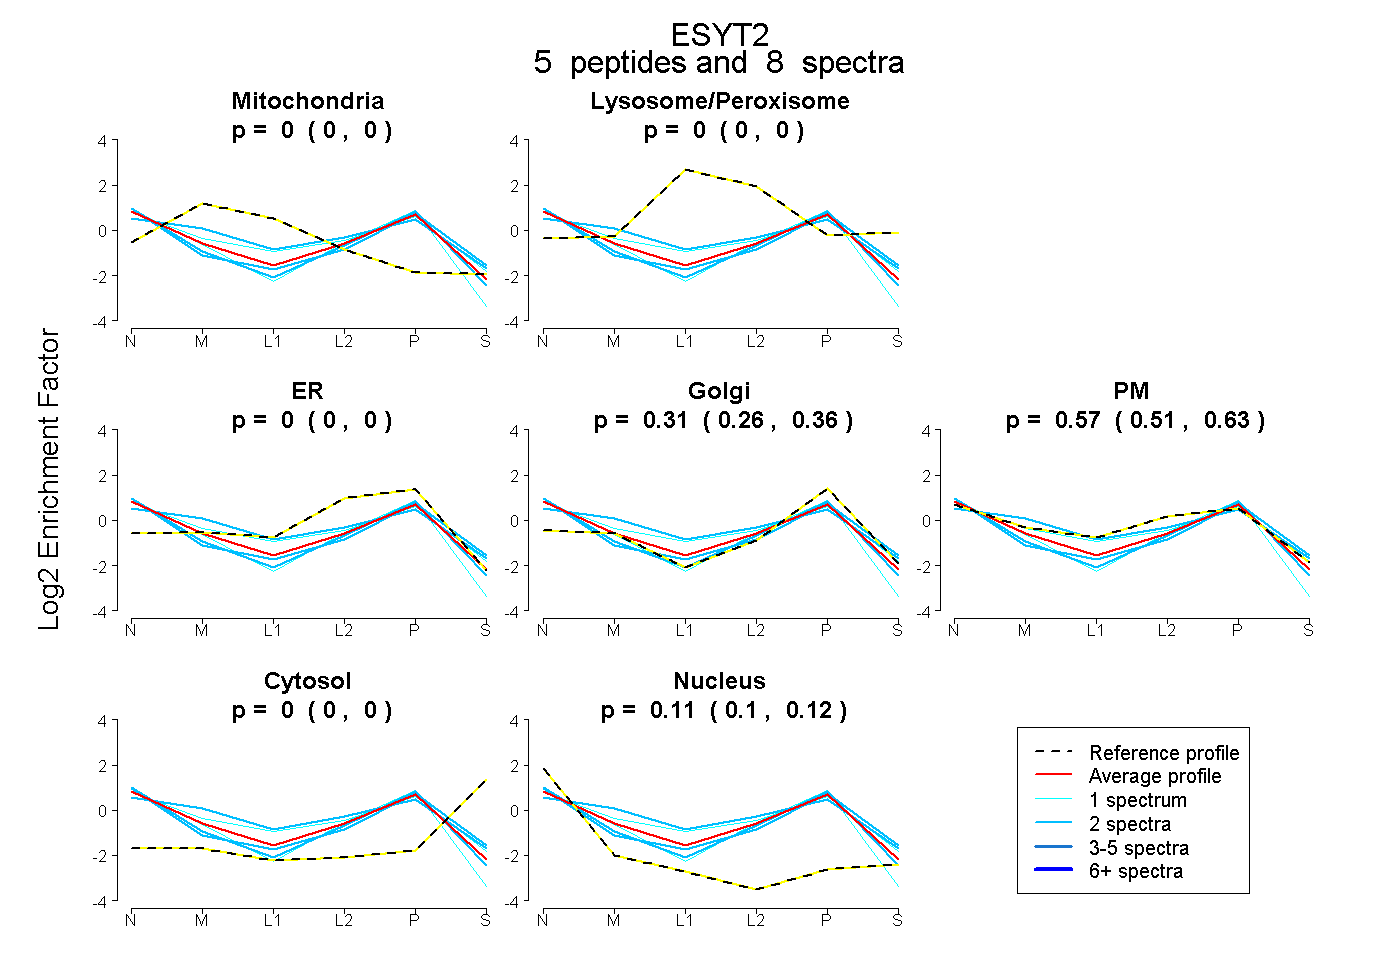
0.000 | 0.000
0.000 | 0.000
0.000 | 0.000
0.261 | 0.357
0.513 | 0.628
0.000 | 0.000
0.095 | 0.124
13peptides
spectra
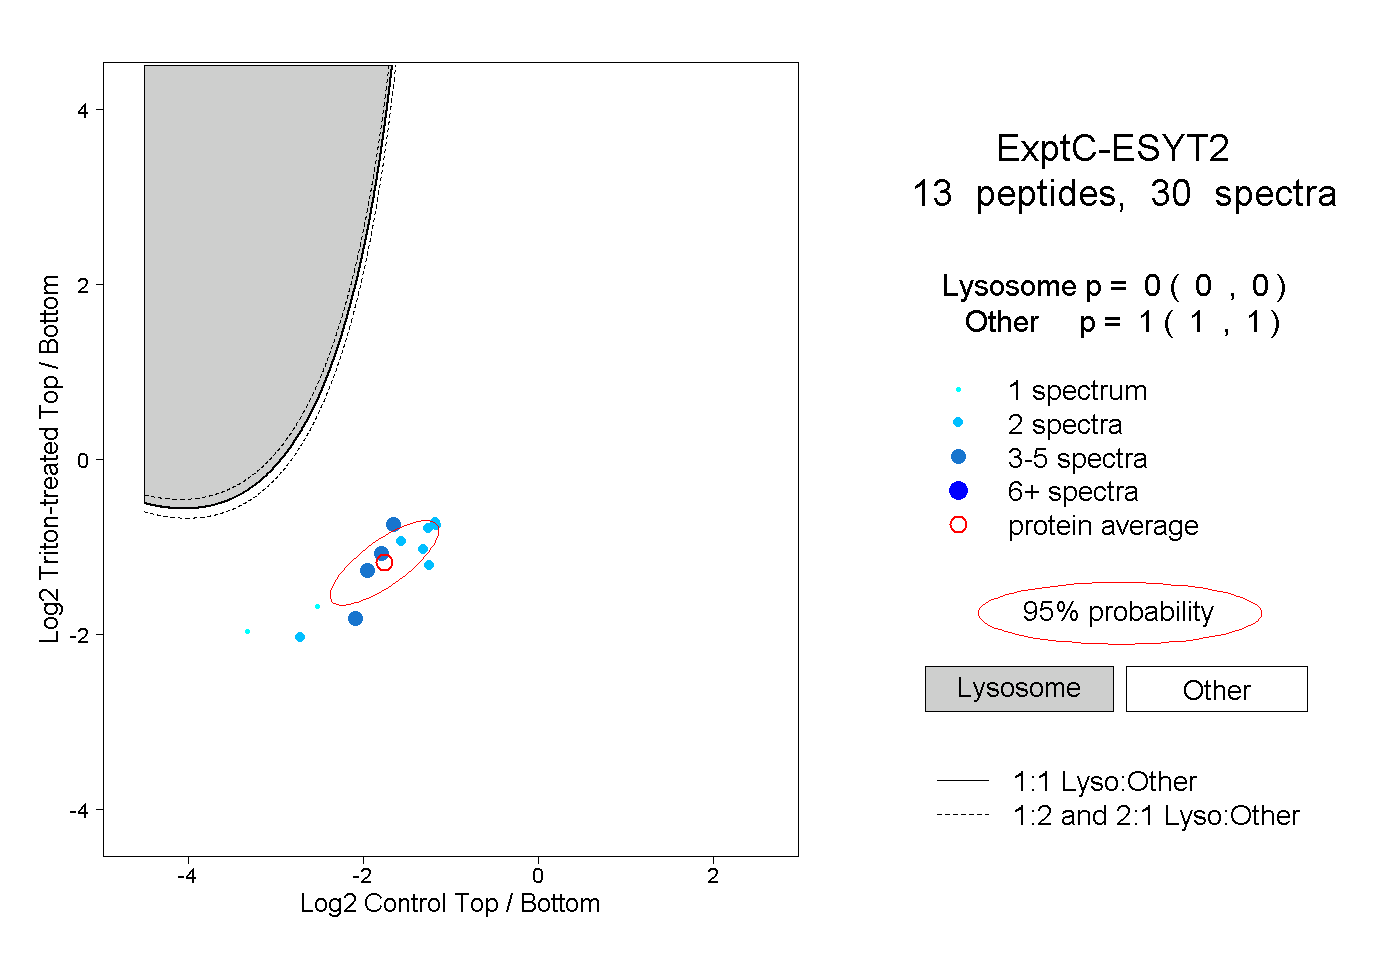
0.000 | 0.000
1.000 | 1.000
2peptides
spectra
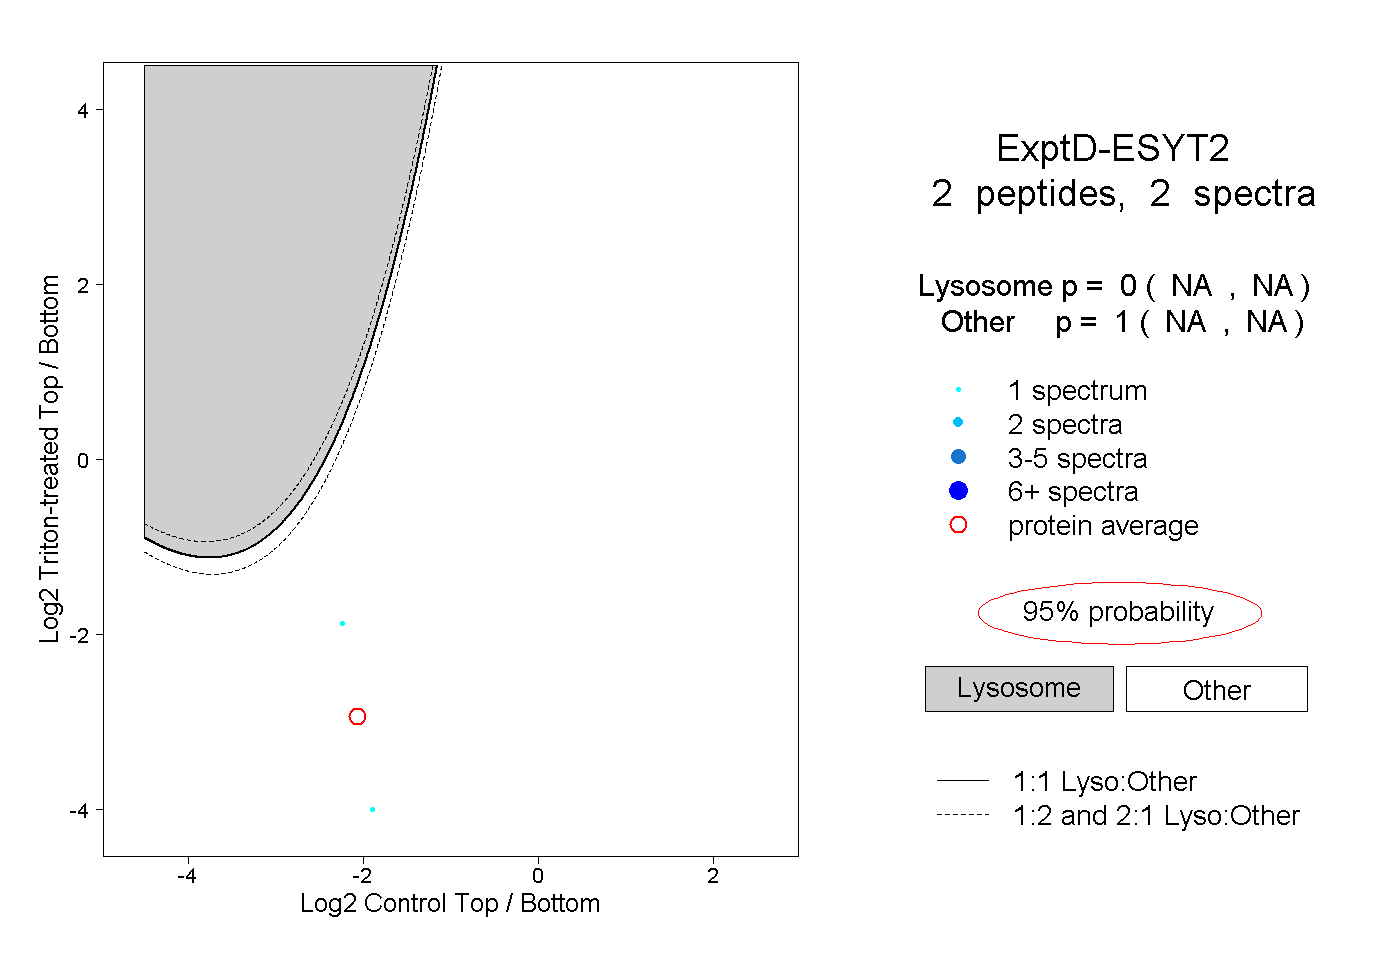
NA | NA
NA | NA