 13
13peptides
spectra
0.000 | 0.004
0.000 | 0.000
0.000 | 0.000
0.000 | 0.003
0.150 | 0.179
0.644 | 0.669
0.090 | 0.112
0.066 | 0.079
| Plot | Mito | Lyso | Perox | ER | Golgi | PM | Cytosol | Nucleus | |||||
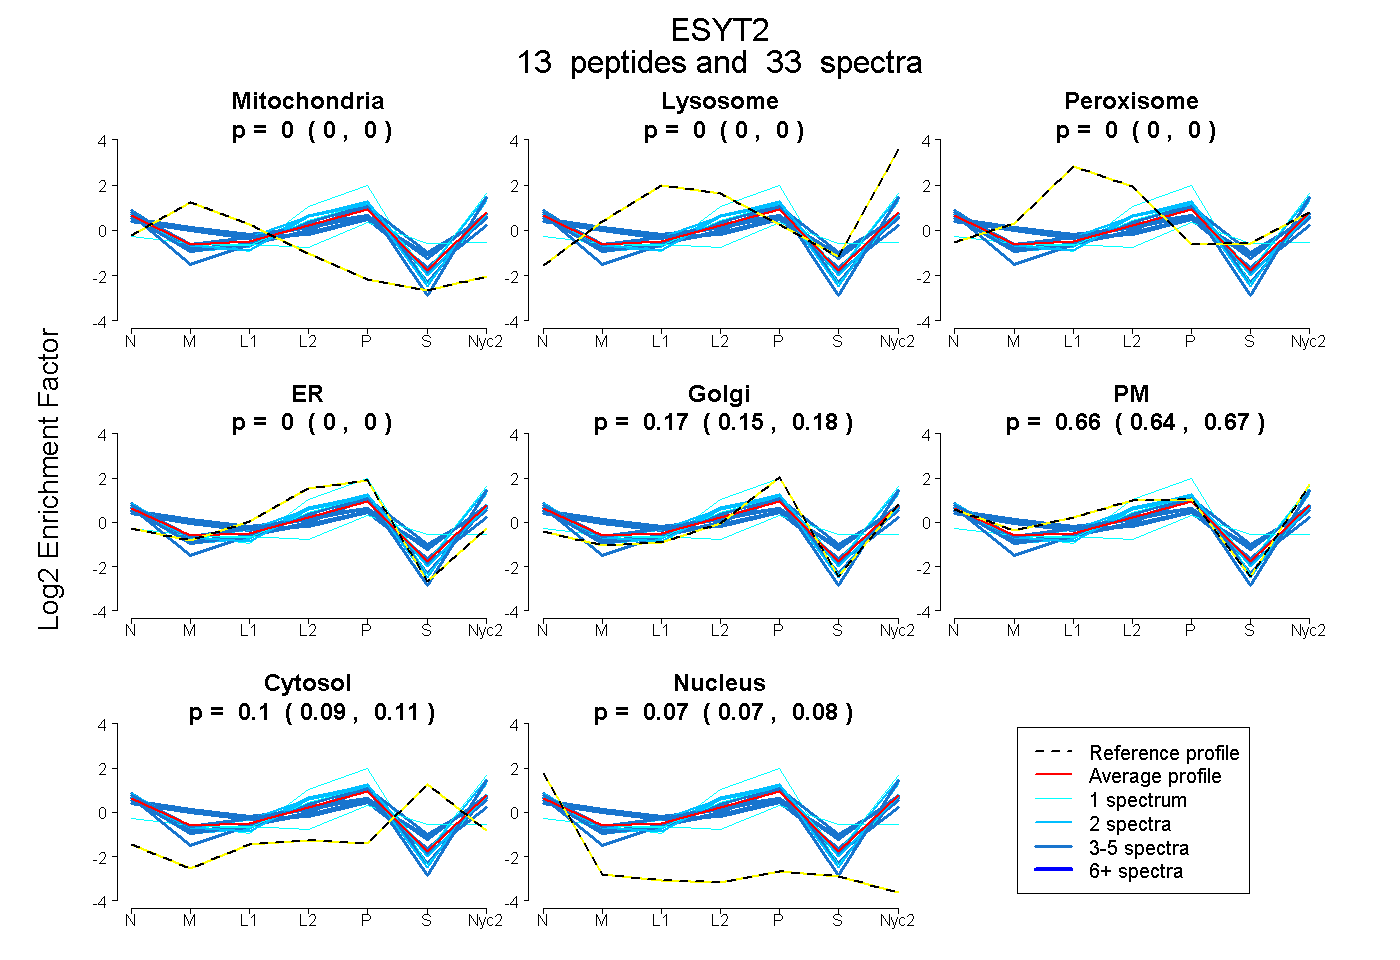
| Expt A |
13 peptides |
33 spectra |
|
0.000 0.000 | 0.004 |
0.000 0.000 | 0.000 |
0.000 0.000 | 0.000 |
0.000 0.000 | 0.003 |
0.166 0.150 | 0.179 |
0.658 0.644 | 0.669 |
0.102 0.090 | 0.112 |
0.073 0.066 | 0.079 |
| 2 spectra, LEWLTLMPDAANLDK | 0.000 | 0.000 | 0.000 | 0.000 | 0.210 | 0.695 | 0.079 | 0.016 | ||
| 3 spectra, IHFIEAQDLQGK | 0.097 | 0.000 | 0.001 | 0.000 | 0.033 | 0.682 | 0.187 | 0.000 | ||
| 1 spectrum, TSEPVWEENFTFFIHNPK | 0.000 | 0.000 | 0.000 | 0.000 | 0.202 | 0.704 | 0.090 | 0.003 | ||
| 1 spectrum, QERPPDYQHSAQVK | 0.085 | 0.000 | 0.057 | 0.000 | 0.157 | 0.297 | 0.281 | 0.124 | ||
| 3 spectra, VLVALASEELAK | 0.000 | 0.000 | 0.000 | 0.000 | 0.163 | 0.760 | 0.000 | 0.077 | ||
| 1 spectrum, IPLSQLLASDNMTINQR | 0.000 | 0.013 | 0.000 | 0.319 | 0.529 | 0.139 | 0.000 | 0.000 | ||
| 2 spectra, VGNQIFQSK | 0.000 | 0.000 | 0.000 | 0.000 | 0.219 | 0.705 | 0.000 | 0.077 | ||
| 3 spectra, NSGGFLSK | 0.198 | 0.000 | 0.000 | 0.000 | 0.132 | 0.543 | 0.114 | 0.014 | ||
| 2 spectra, VLHLEK | 0.000 | 0.000 | 0.000 | 0.175 | 0.122 | 0.594 | 0.051 | 0.057 | ||
| 4 spectra, ETIEPAVR | 0.000 | 0.000 | 0.000 | 0.042 | 0.239 | 0.604 | 0.000 | 0.115 | ||
| 3 spectra, NLIAFSEDGSDPYVR | 0.000 | 0.000 | 0.000 | 0.000 | 0.034 | 0.634 | 0.265 | 0.067 | ||
| 4 spectra, LIVVVHSCR | 0.000 | 0.000 | 0.000 | 0.000 | 0.250 | 0.459 | 0.252 | 0.039 | ||
| 4 spectra, VDVGHQPLR | 0.244 | 0.000 | 0.000 | 0.030 | 0.174 | 0.495 | 0.055 | 0.002 |
| Plot | Mito | Lyso or Perox | ER | Golgi | PM | Cytosol | Nucleus | ||||||
| Expt B |
5 peptides |
8 spectra |
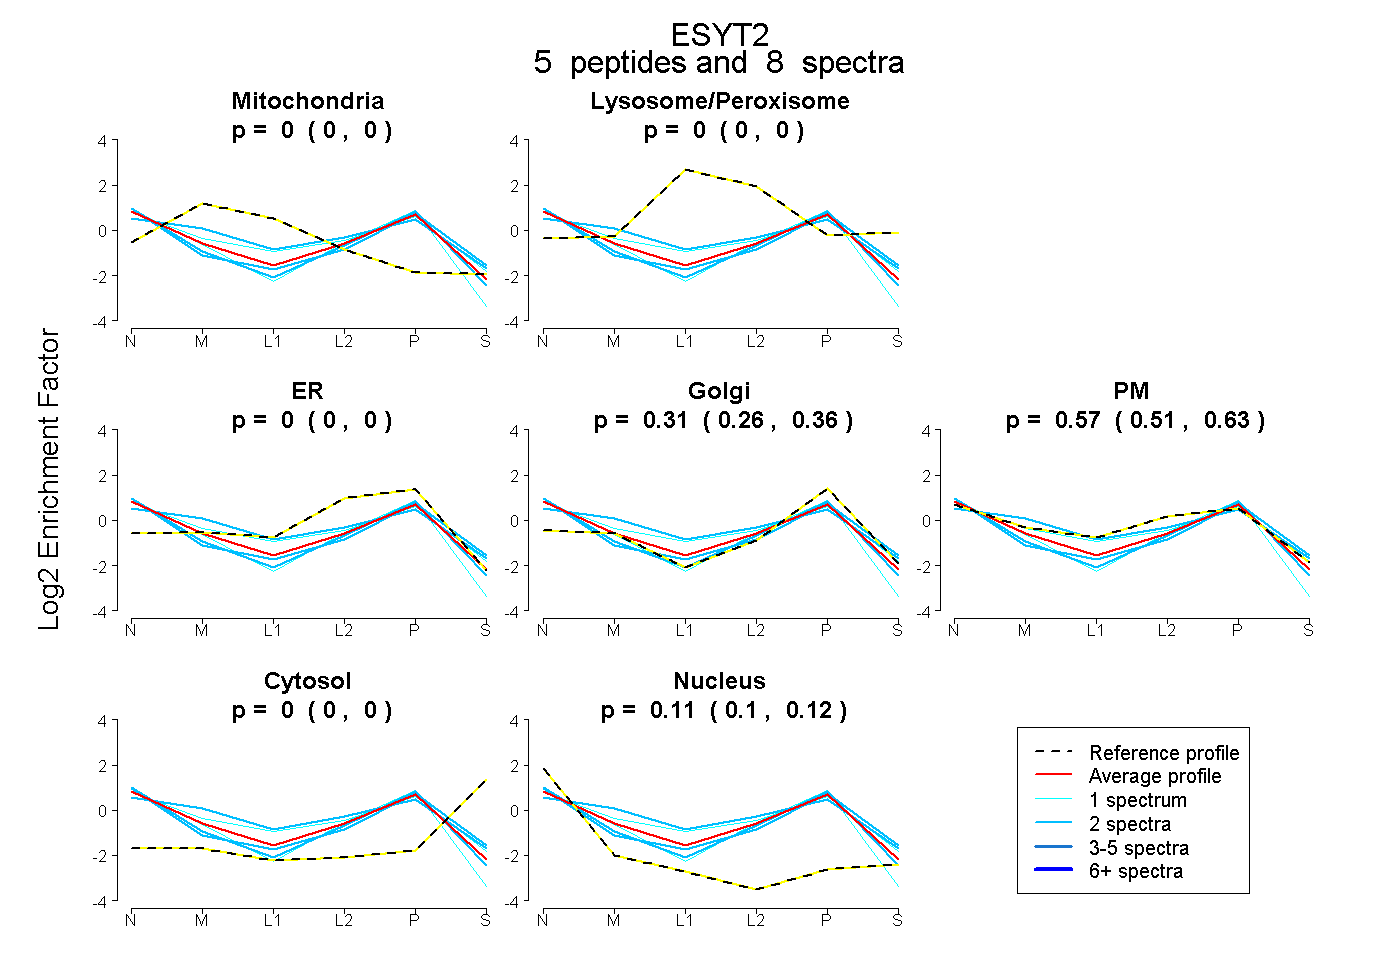 |
0.000 0.000 | 0.000 |
0.000 0.000 | 0.000 |
0.000 0.000 | 0.000 |
0.315 0.261 | 0.357 |
0.574 0.513 | 0.628 |
0.000 0.000 | 0.000 |
0.112 0.095 | 0.124 |
|||
| Plot | Lyso | Other | |||||||||||
| Expt C |
13 peptides |
30 spectra |
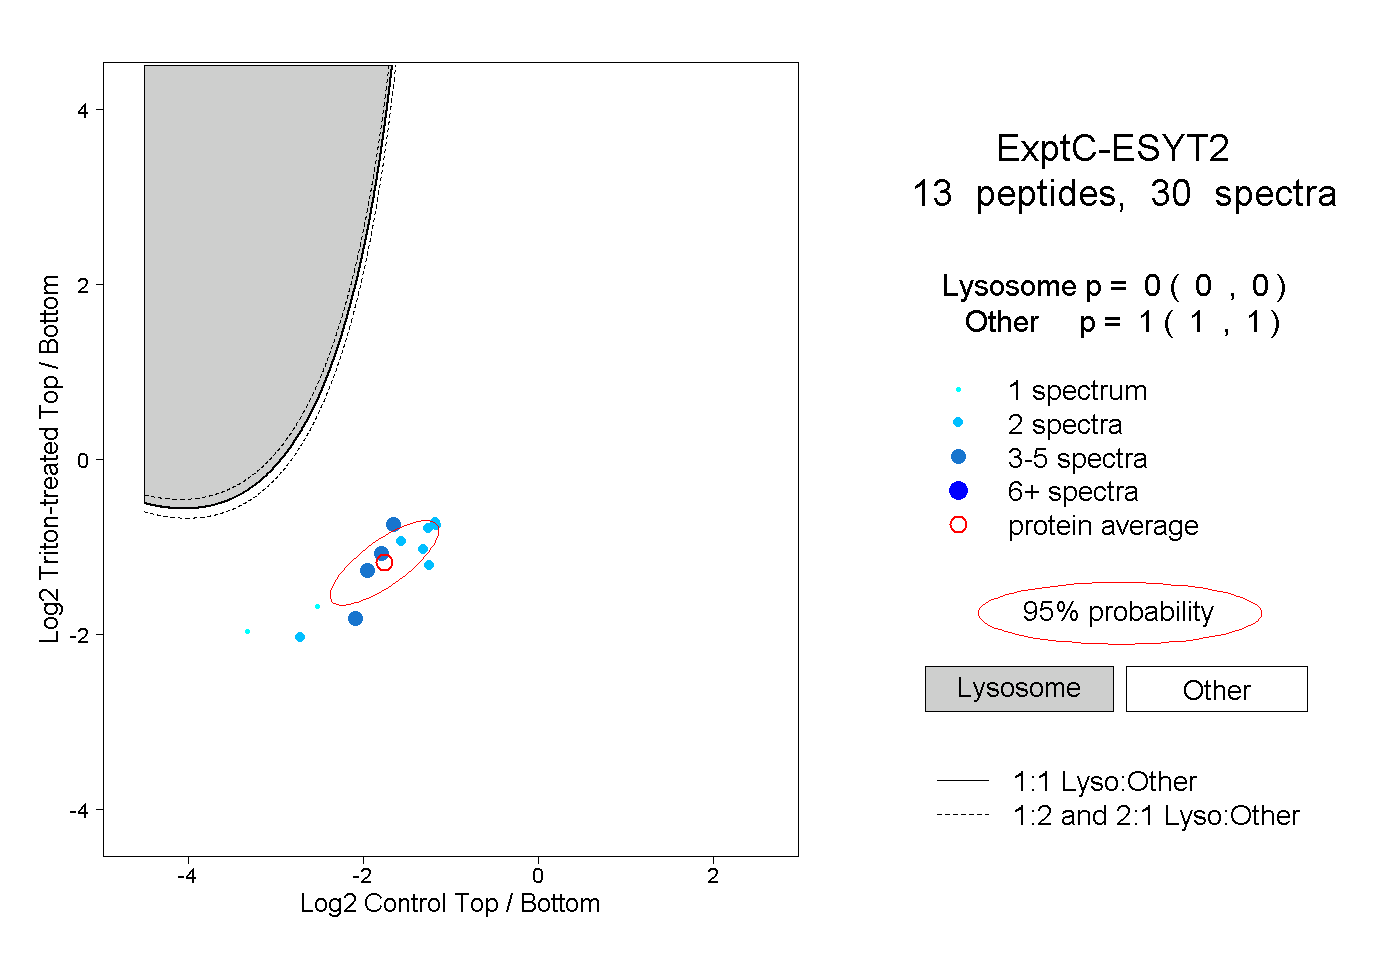 |
0.000 0.000 | 0.000 |
1.000 1.000 | 1.000 |
||||||||
| Plot | Lyso | Other | |||||||||||
| Expt D |
2 peptides |
2 spectra |
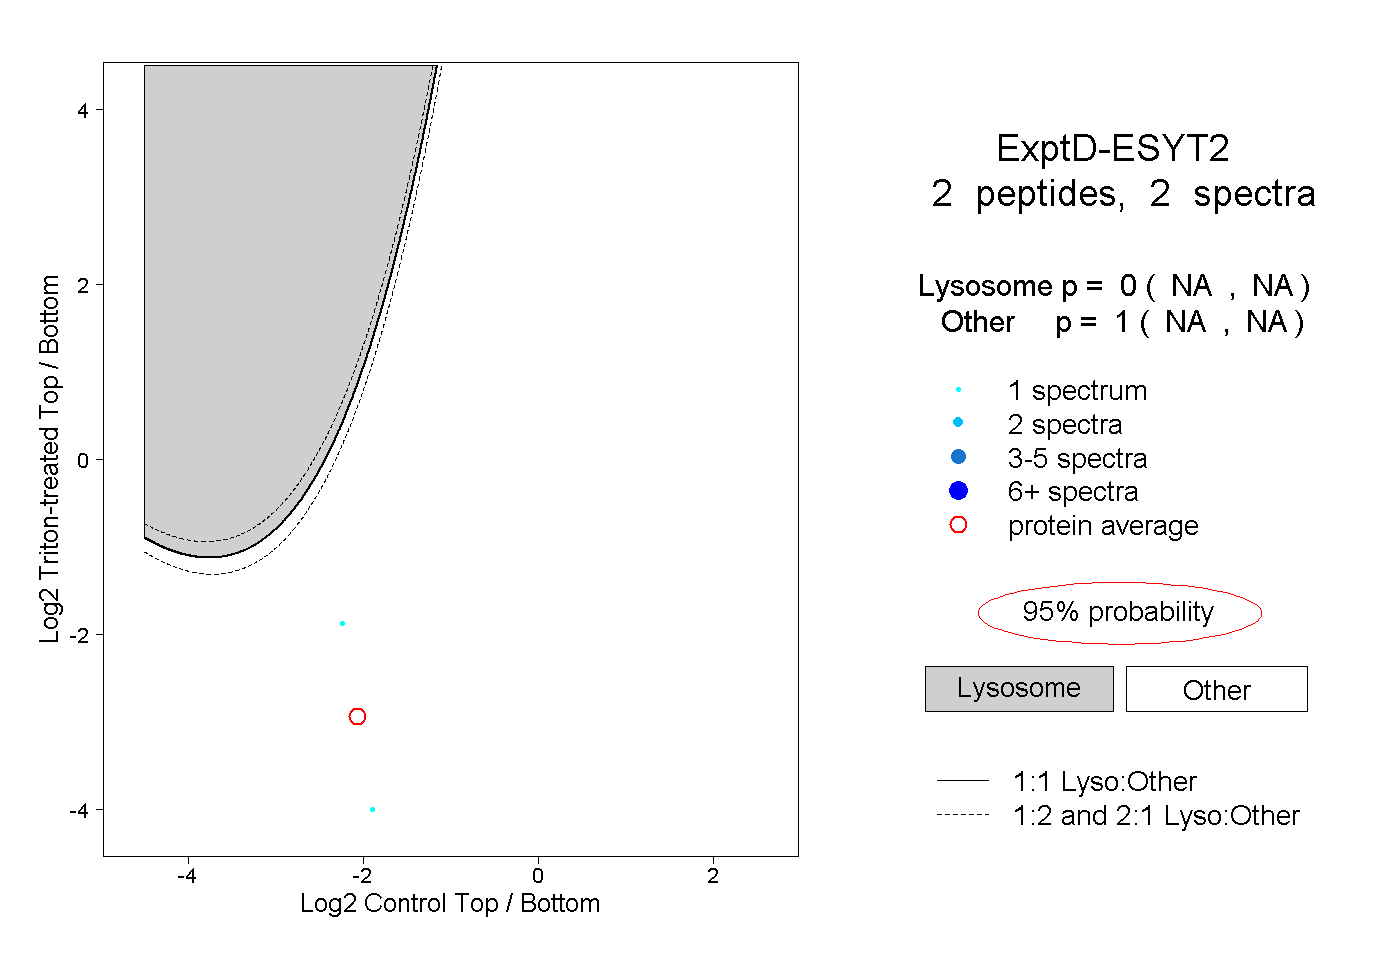 |
0.000 NA | NA |
1.000 NA | NA |