 18
18peptides
spectra
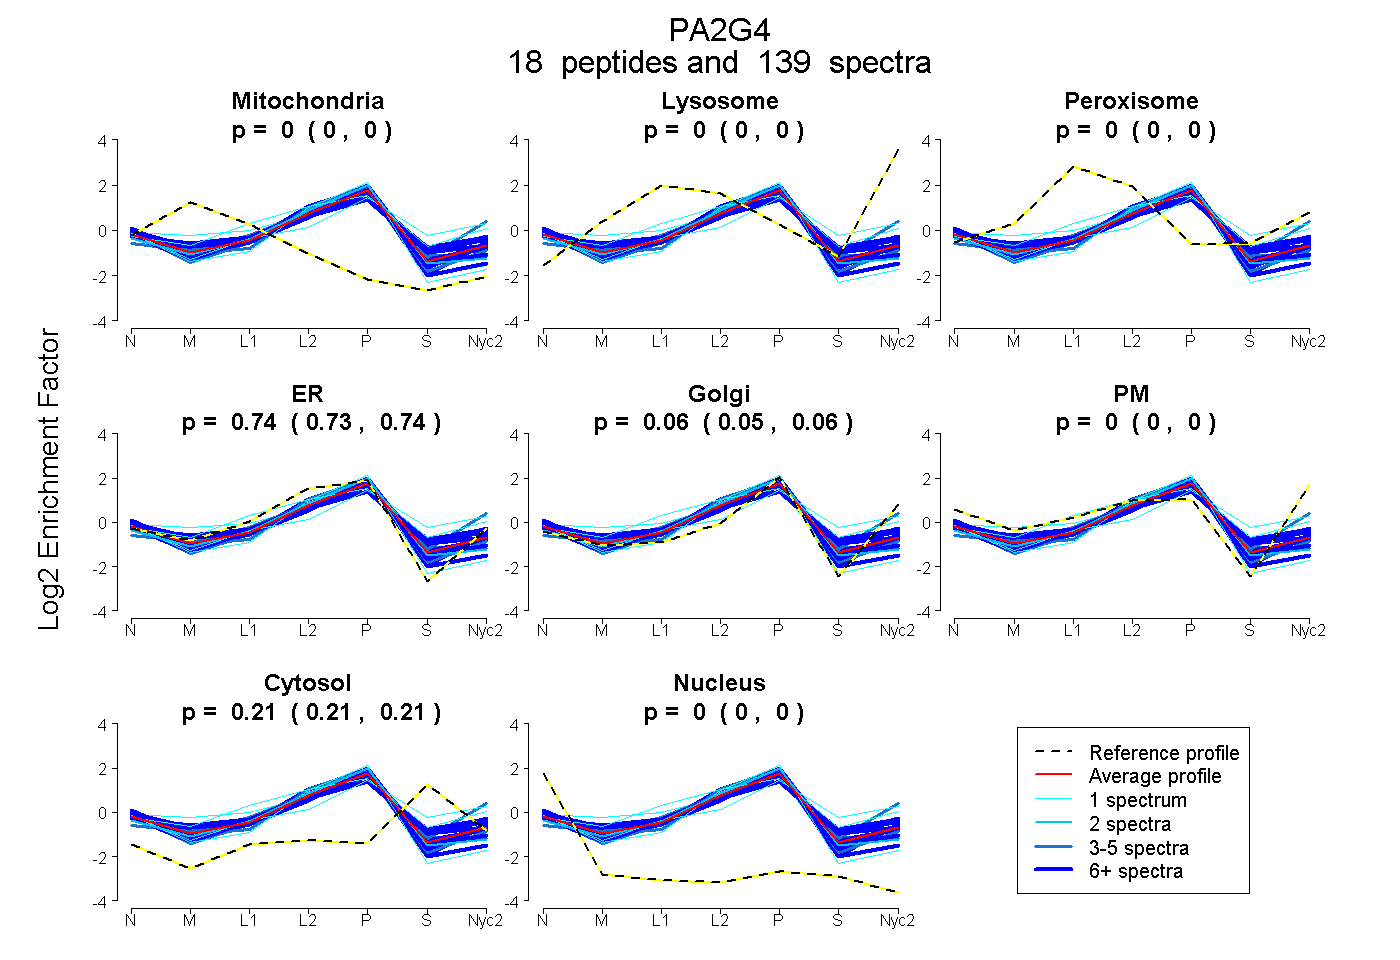
0.000 | 0.000
0.000 | 0.000
0.000 | 0.000
0.730 | 0.740
0.049 | 0.062
0.000 | 0.000
0.205 | 0.210
0.000 | 0.001
14peptides
spectra
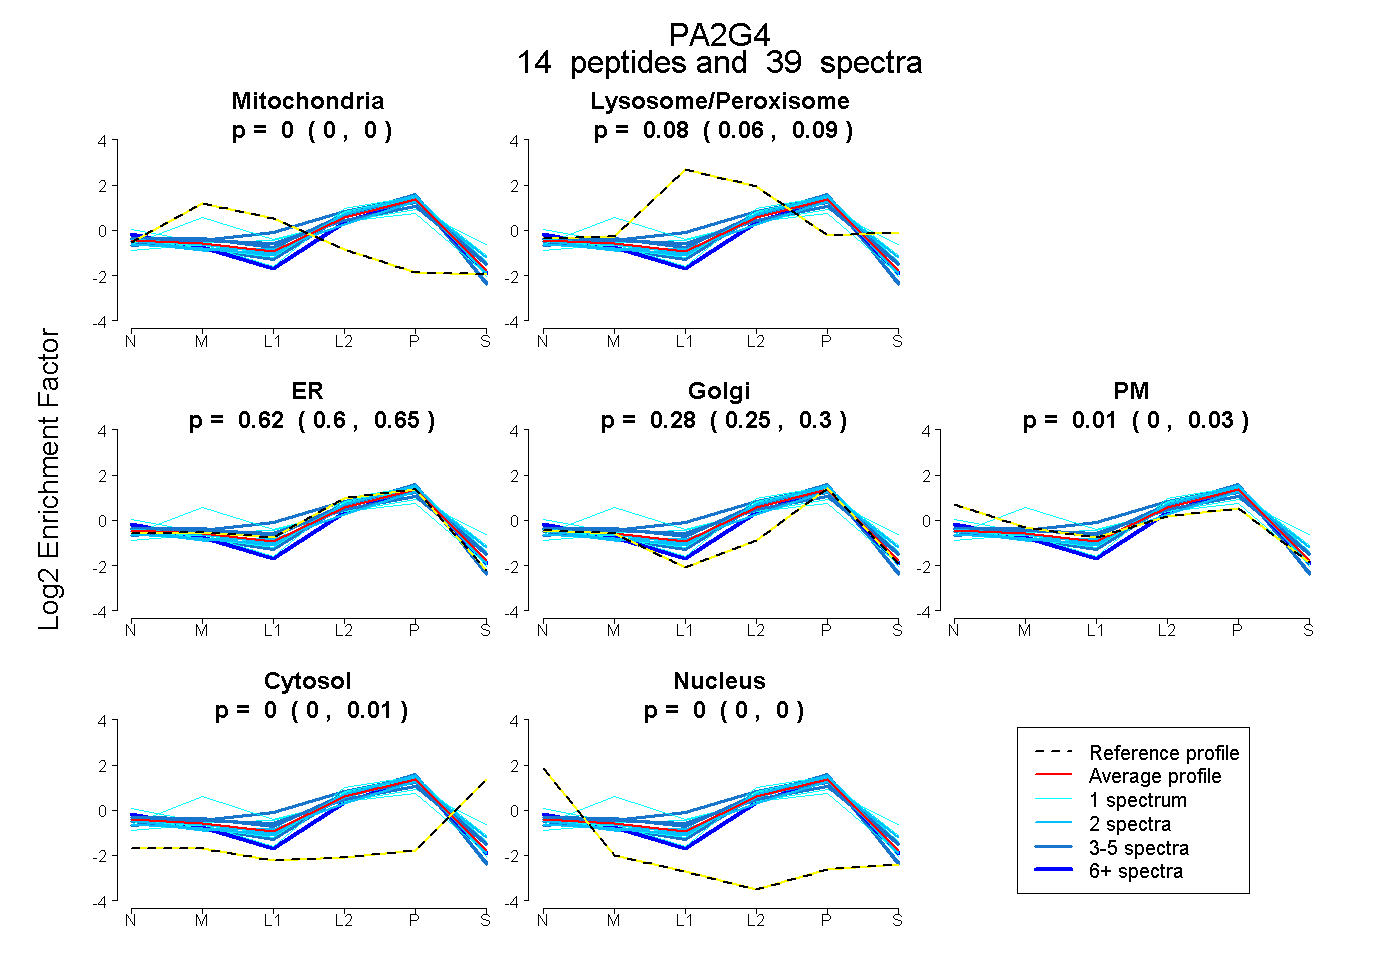
0.000 | 0.000
0.060 | 0.090
0.597 | 0.648
0.255 | 0.304
0.000 | 0.025
0.000 | 0.012
0.000 | 0.000
19peptides
spectra
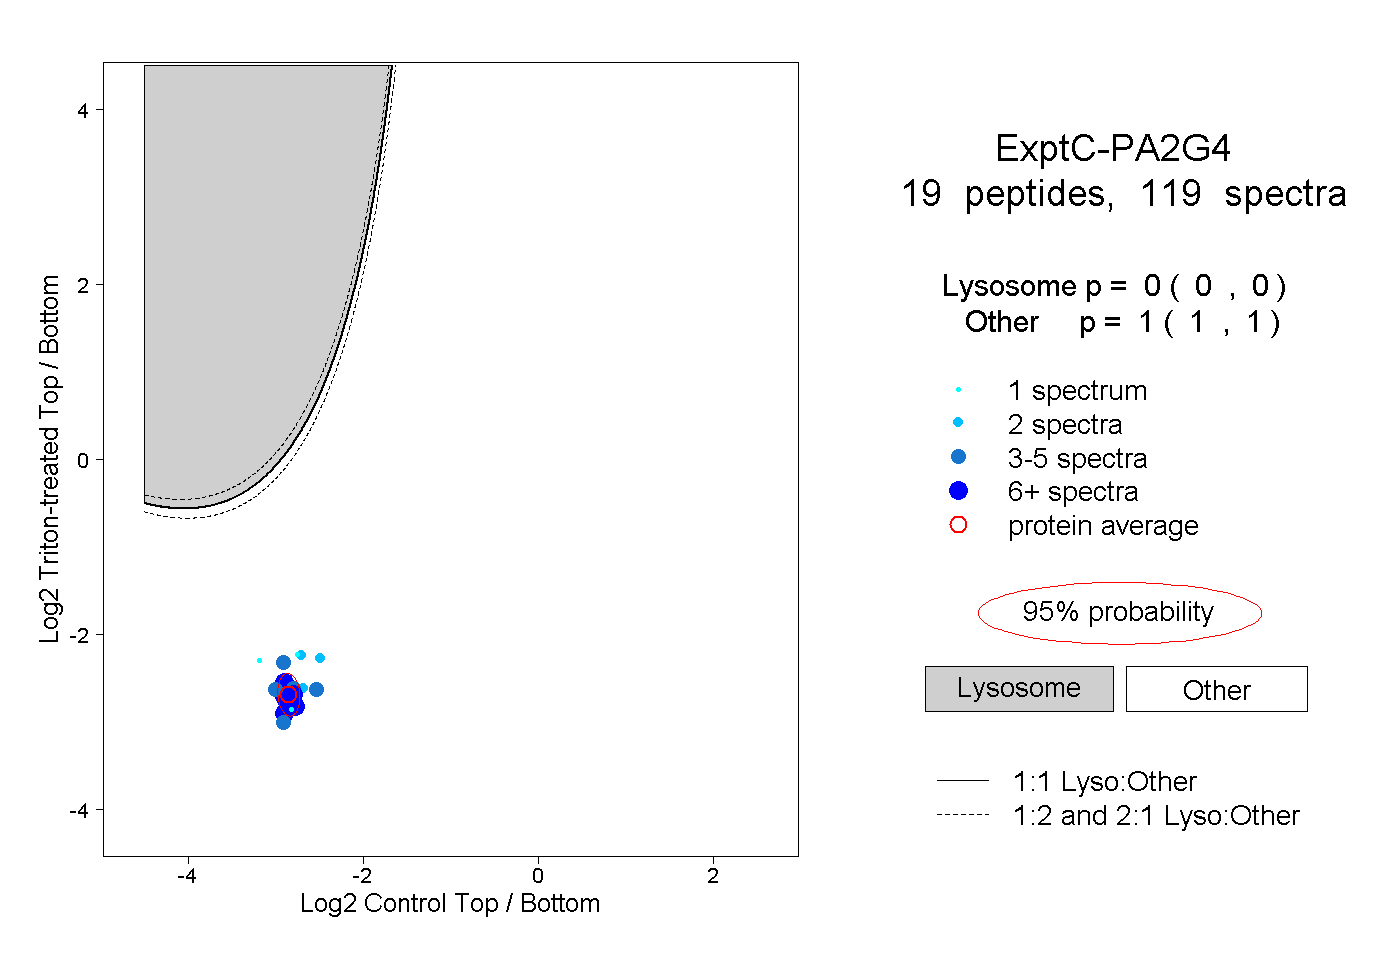
0.000 | 0.000
1.000 | 1.000
11peptides
spectra
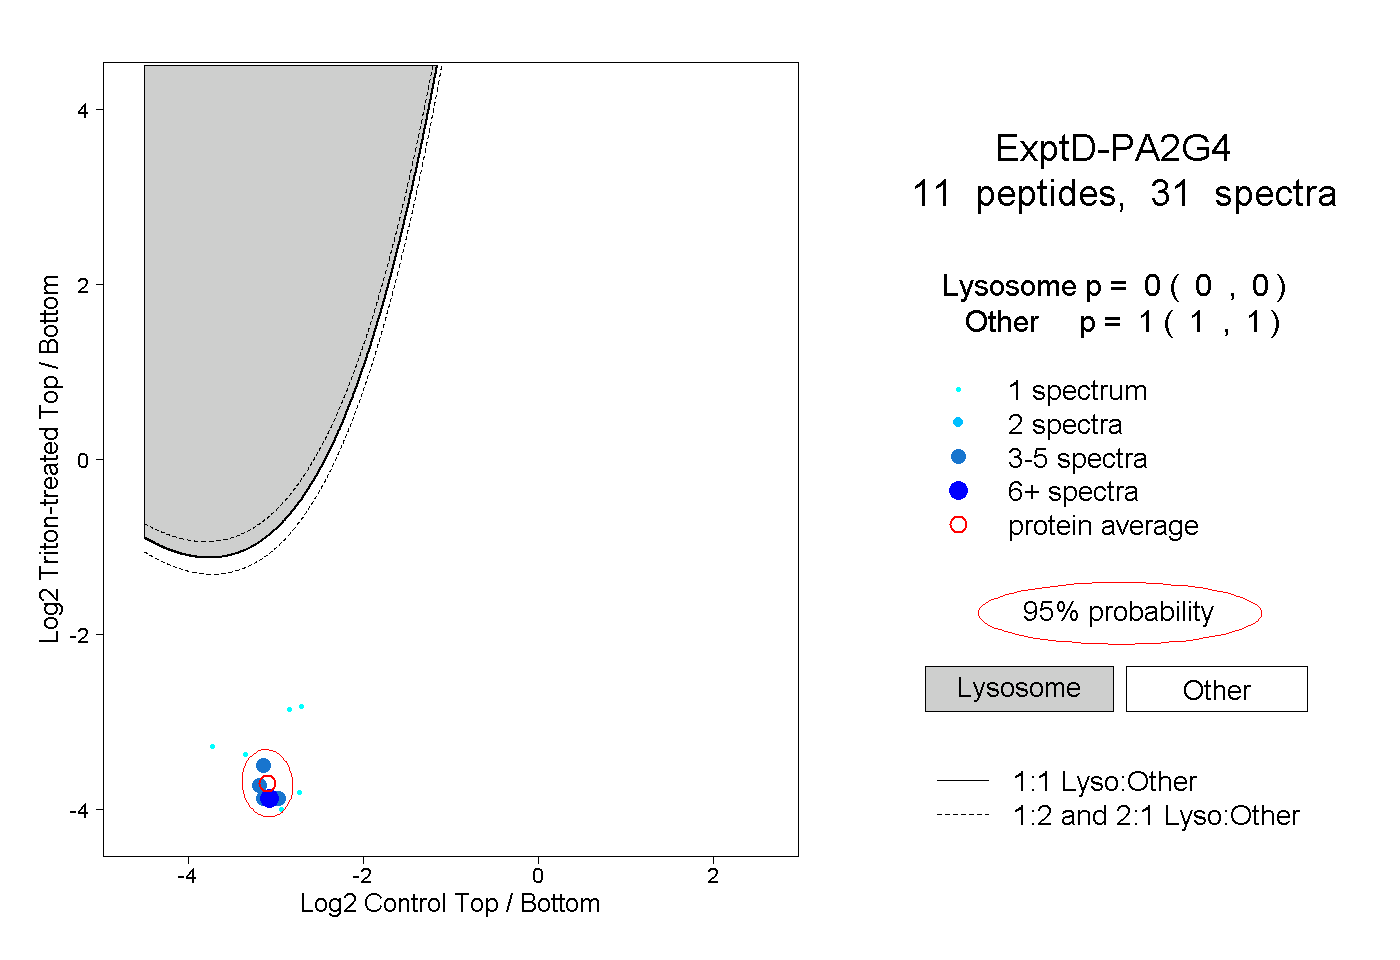
0.000 | 0.000
1.000 | 1.000