PA2G4
[ENSRNOP00000006578]
Main page
| | | Plot |
Mito |
Lyso |
|
Perox |
ER |
Golgi |
PM |
Cytosol |
Nucleus |
|
| Expt A |
 18
18
peptides |
139
spectra |
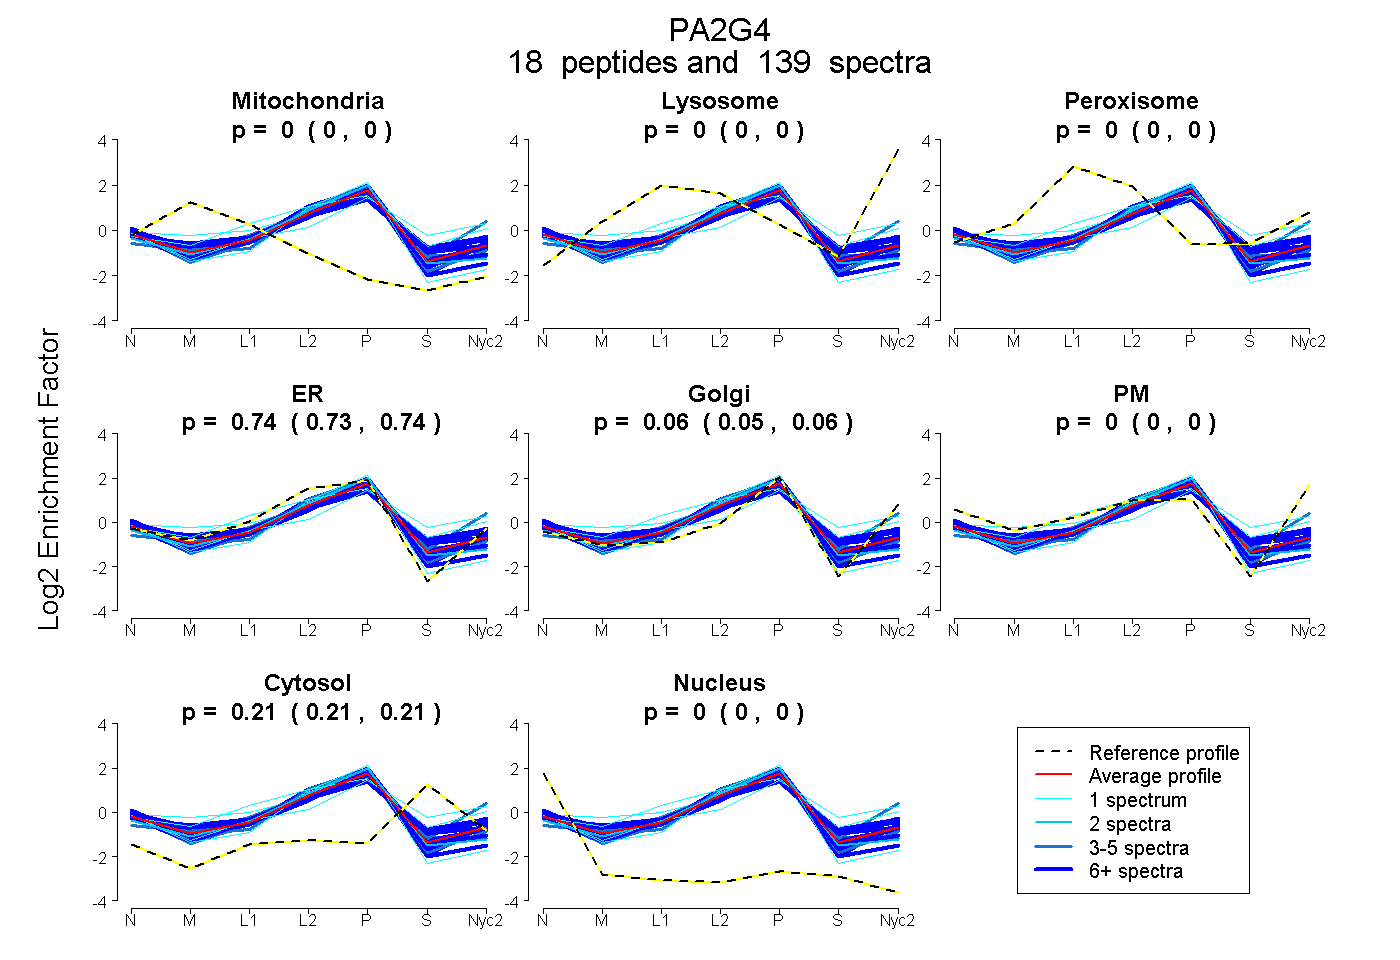 |
0.000
0.000 | 0.000 |
0.000
0.000 | 0.000 |
|
0.000
0.000 | 0.000 |
0.736
0.730 | 0.740 |
0.056
0.049 | 0.062 |
0.000
0.000 | 0.000 |
0.208
0.205 | 0.210 |
0.000
0.000 | 0.001 |
|
| | | Plot |
Mito |
|
Lyso or Perox |
|
ER |
Golgi |
PM |
Cytosol |
Nucleus |
|
| Expt B |
14
peptides |
39
spectra |
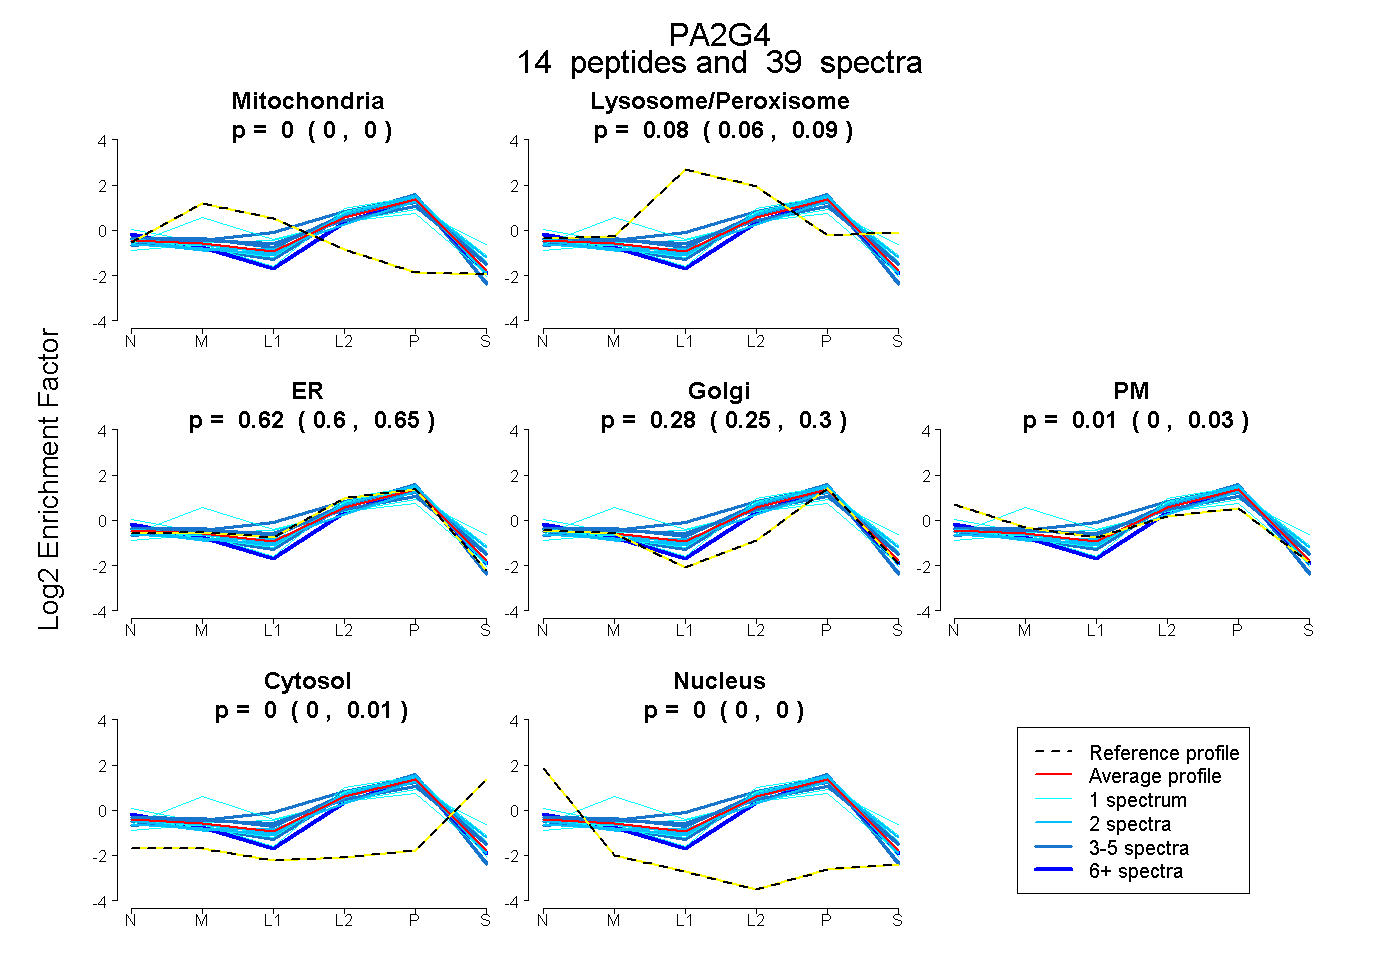 |
0.000
0.000 | 0.000 |
|
0.077
0.060 | 0.090 |
|
0.624
0.597 | 0.648 |
0.284
0.255 | 0.304 |
0.010
0.000 | 0.025 |
0.005
0.000 | 0.012 |
0.000
0.000 | 0.000 |
|
| 1 spectrum, FDAMPFTLR |
0.000 |
|
0.000 |
|
0.807 |
0.101 |
0.000 |
0.092 |
0.000 |
|
| 2 spectra, TTIYK |
0.000 |
|
0.005 |
|
0.805 |
0.168 |
0.000 |
0.022 |
0.000 |
|
| 1 spectrum, GDAMIMEETGK |
0.000 |
|
0.333 |
|
0.000 |
0.427 |
0.192 |
0.048 |
0.000 |
|
| 4 spectra, AFFSEVER |
0.000 |
|
0.000 |
|
0.754 |
0.246 |
0.000 |
0.000 |
0.000 |
|
| 12 spectra, ALLQSSASR |
0.000 |
|
0.000 |
|
0.452 |
0.459 |
0.089 |
0.000 |
0.000 |
|
| 1 spectrum, MGGDIANR |
0.000 |
|
0.027 |
|
0.779 |
0.068 |
0.000 |
0.125 |
0.000 |
|
| 2 spectra, SEMEVQDAELK |
0.000 |
|
0.155 |
|
0.401 |
0.370 |
0.000 |
0.075 |
0.000 |
|
| 4 spectra, HELLQPFNVLYEK |
0.000 |
|
0.173 |
|
0.472 |
0.311 |
0.044 |
0.000 |
0.000 |
|
| 3 spectra, AAHLCAEAALR |
0.010 |
|
0.085 |
|
0.905 |
0.000 |
0.000 |
0.000 |
0.000 |
|
| 1 spectrum, EGEFVAQFK |
0.000 |
|
0.000 |
|
0.878 |
0.122 |
0.000 |
0.000 |
0.000 |
|
| 3 spectra, ITSGPFEPDLYK |
0.000 |
|
0.231 |
|
0.331 |
0.425 |
0.013 |
0.000 |
0.000 |
|
| 2 spectra, AFEDEK |
0.000 |
|
0.021 |
|
0.738 |
0.168 |
0.000 |
0.073 |
0.000 |
|
| 1 spectrum, FTVLLMPNGPMR |
0.297 |
|
0.000 |
|
0.665 |
0.038 |
0.000 |
0.000 |
0.000 |
|
| 2 spectra, TIIQNPTDQQK |
0.000 |
|
0.047 |
|
0.669 |
0.254 |
0.030 |
0.000 |
0.000 |
|
| | | Plot |
|
Lyso |
|
|
|
|
|
|
|
Other |
| Expt C |
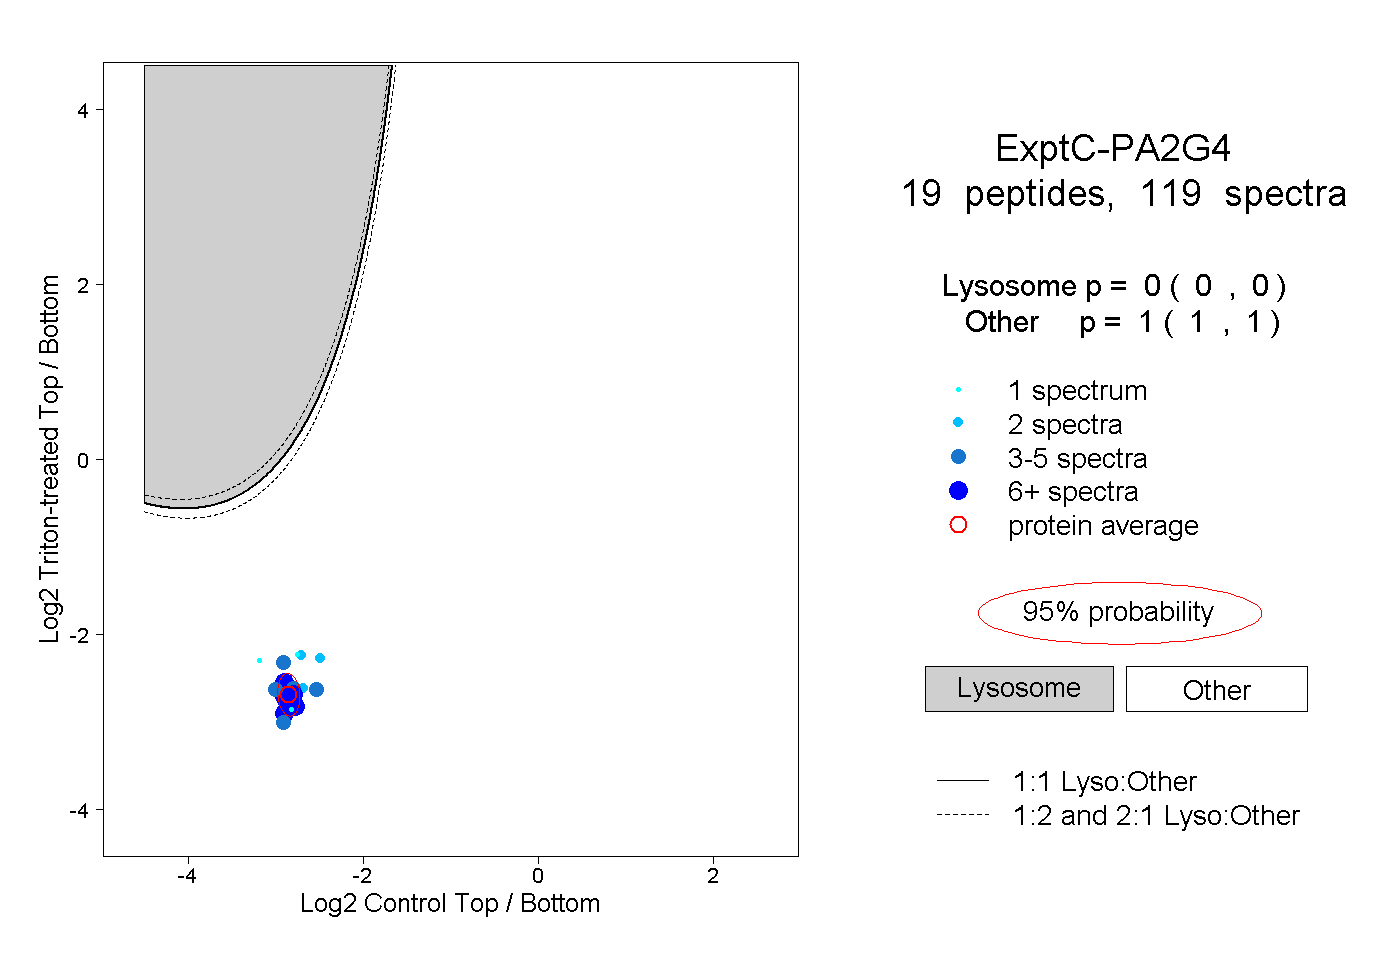
19
peptides |
119
spectra |
 |
|
0.000
0.000 | 0.000 |
|
|
|
|
|
|
|
1.000
1.000 | 1.000 |
| | | Plot |
|
Lyso |
|
|
|
|
|
|
|
Other |
| Expt D |
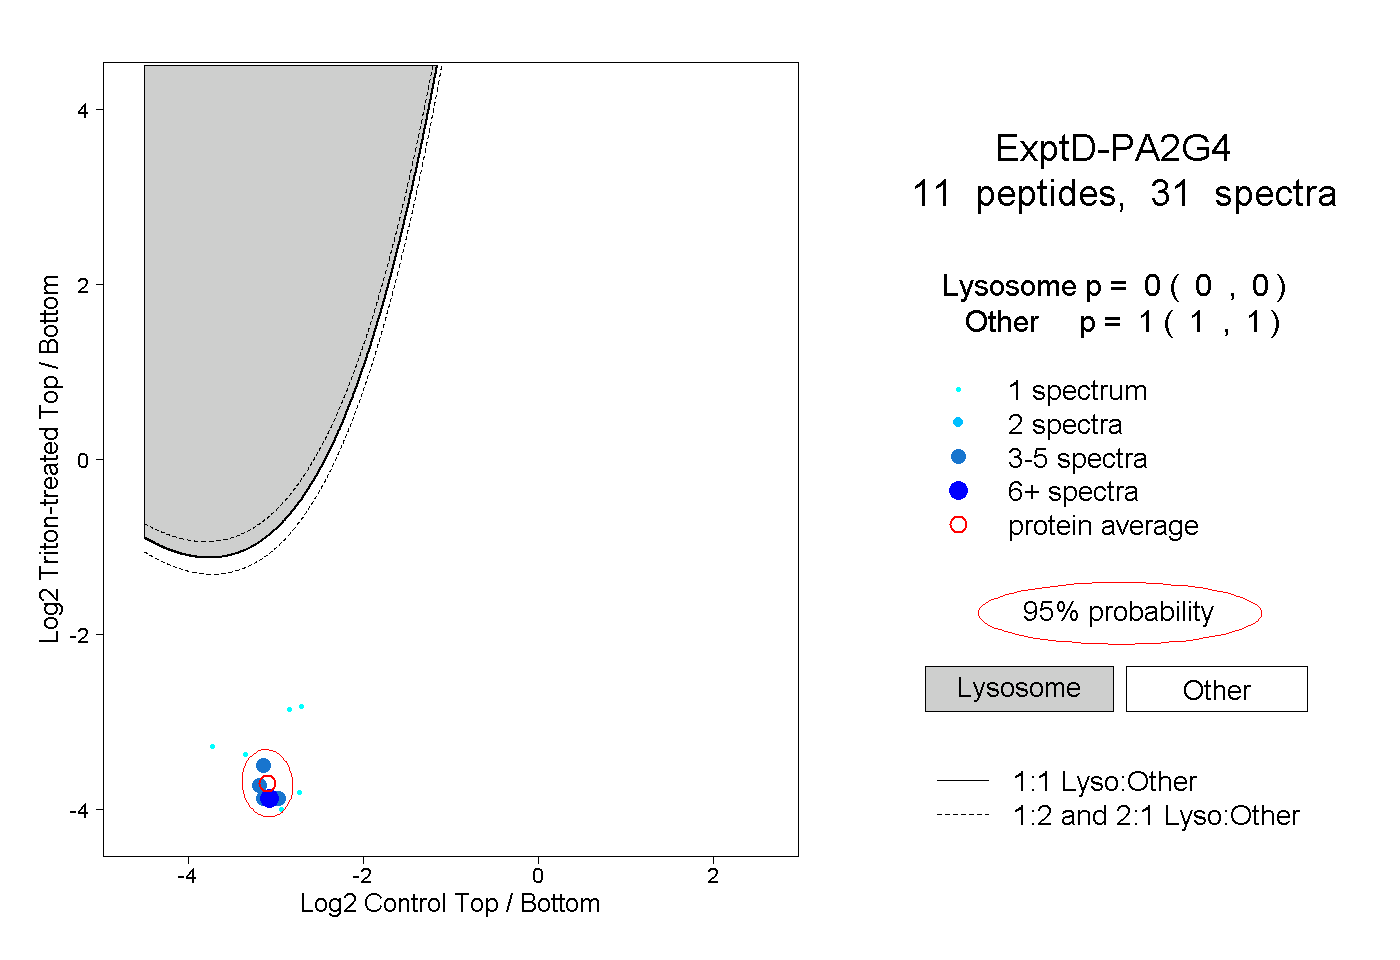
11
peptides |
31
spectra |
 |
|
0.000
0.000 | 0.000 |
|
|
|
|
|
|
|
1.000
1.000 | 1.000 |