 29
29peptides
spectra
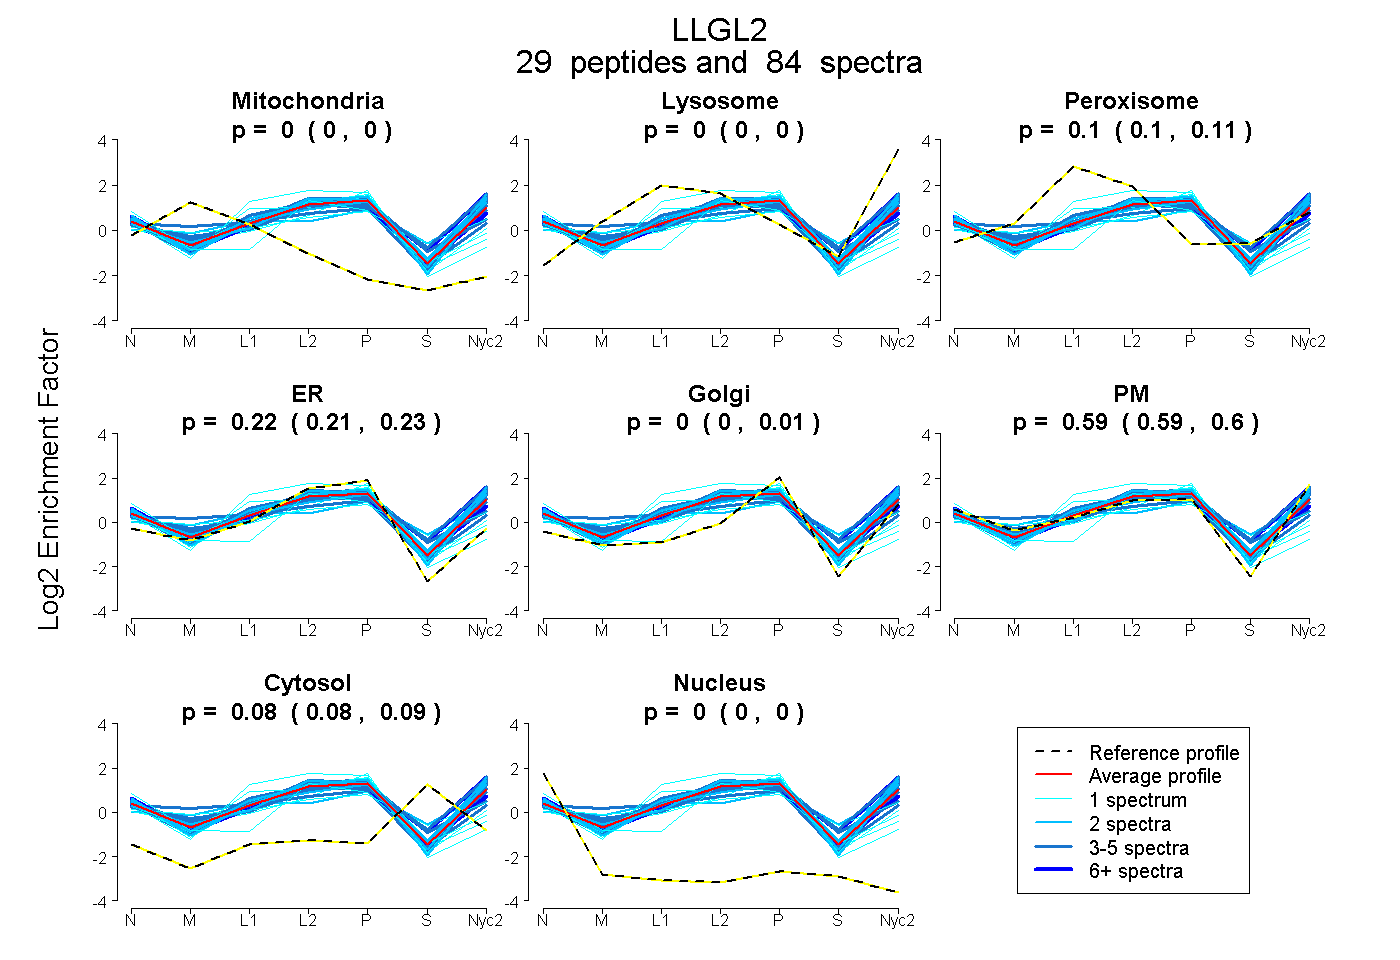
0.000 | 0.000
0.000 | 0.000
0.099 | 0.106
0.208 | 0.226
0.000 | 0.006
0.586 | 0.601
0.081 | 0.085
0.000 | 0.000
12peptides
spectra
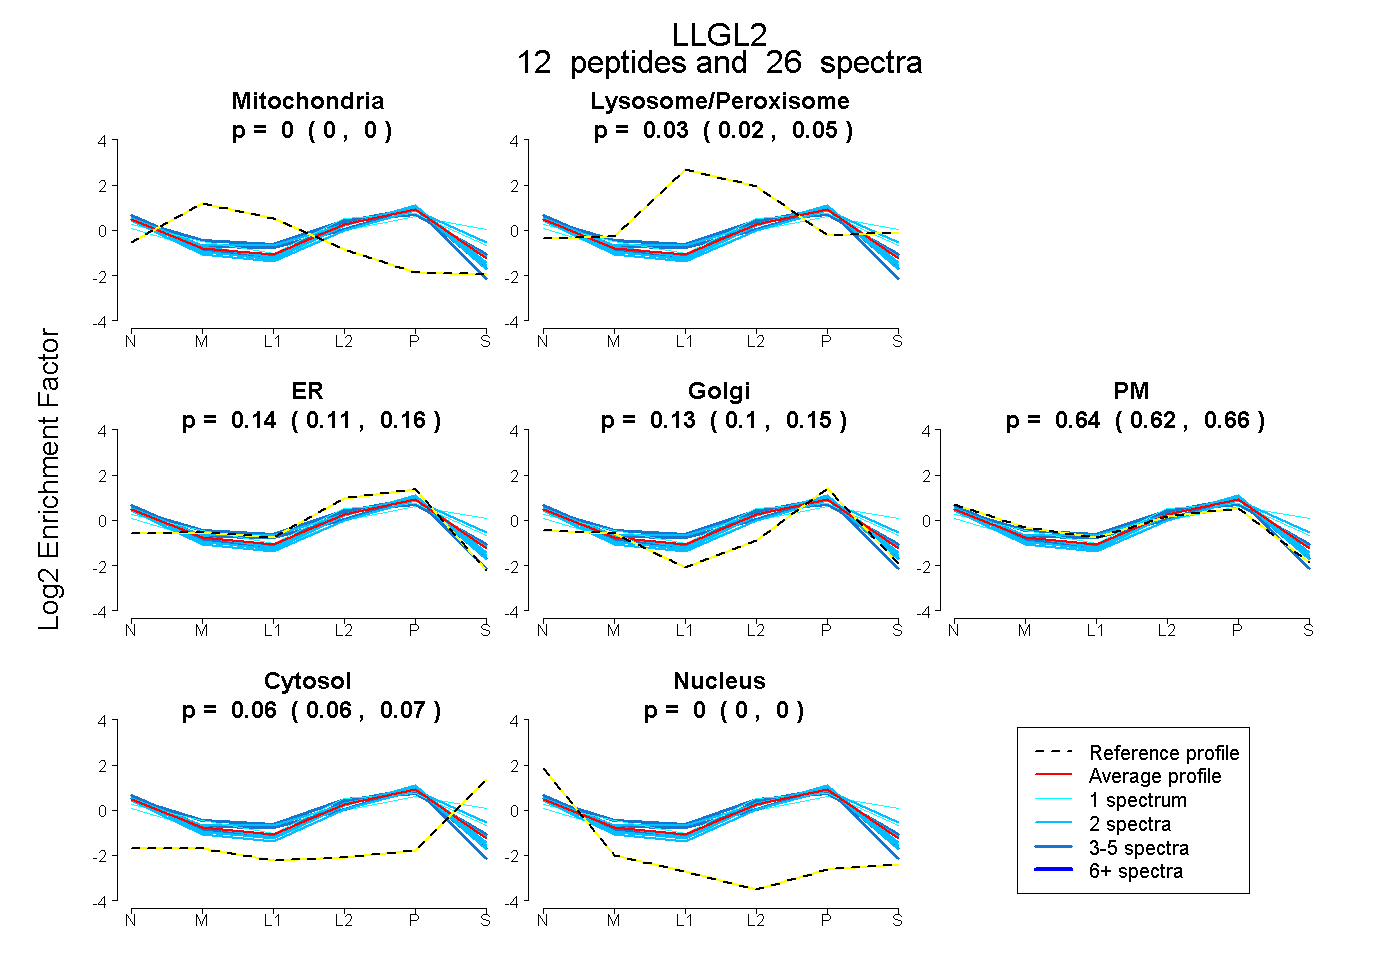
0.000 | 0.000
0.016 | 0.047
0.106 | 0.159
0.096 | 0.151
0.622 | 0.656
0.057 | 0.070
0.000 | 0.000
31peptides
spectra
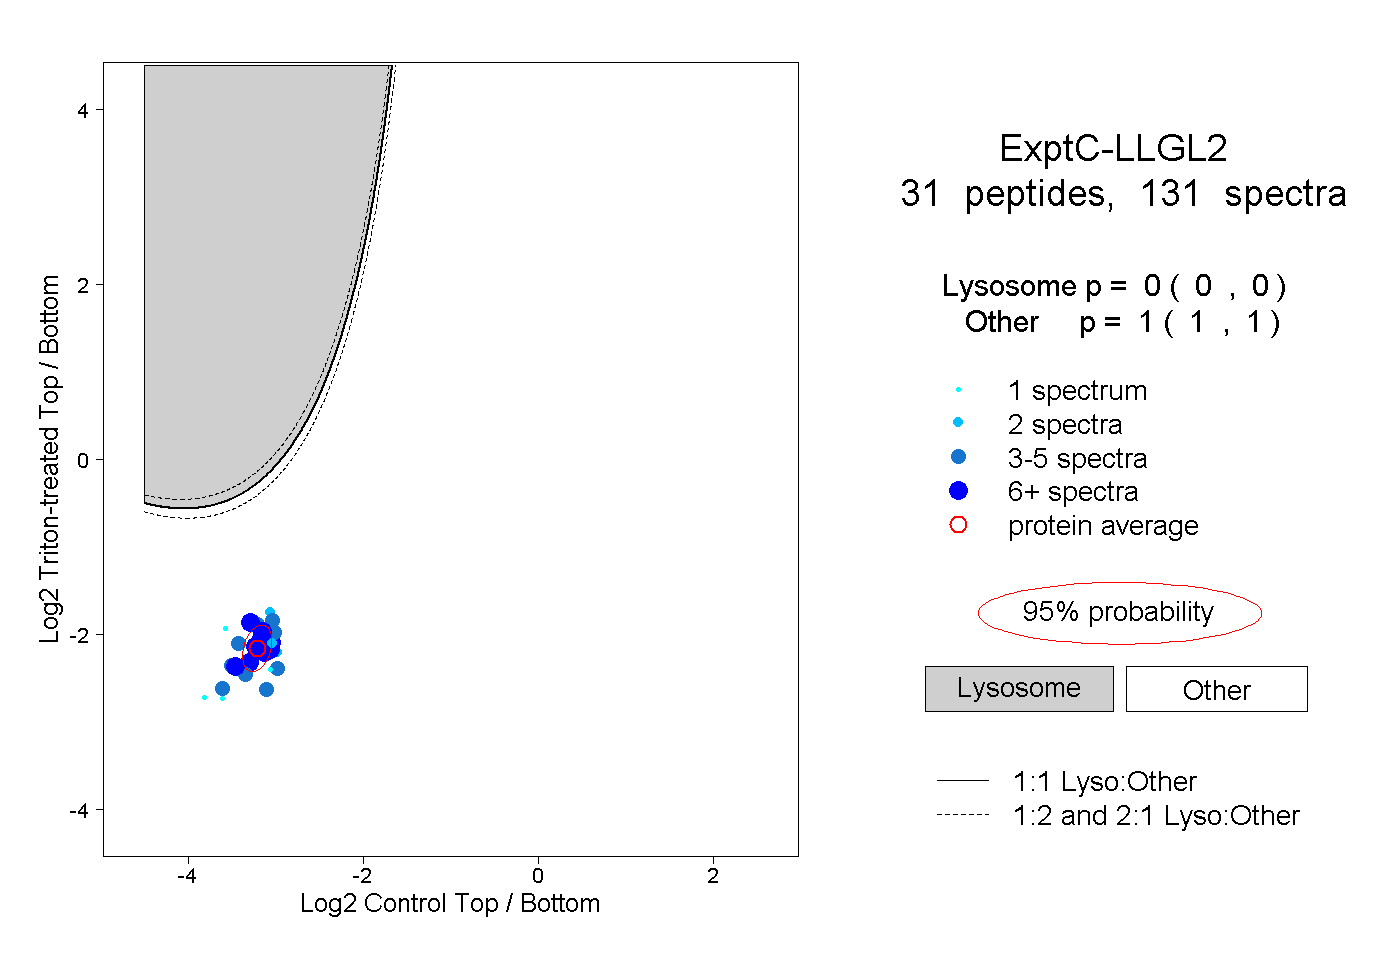
0.000 | 0.000
1.000 | 1.000
7peptides
spectra
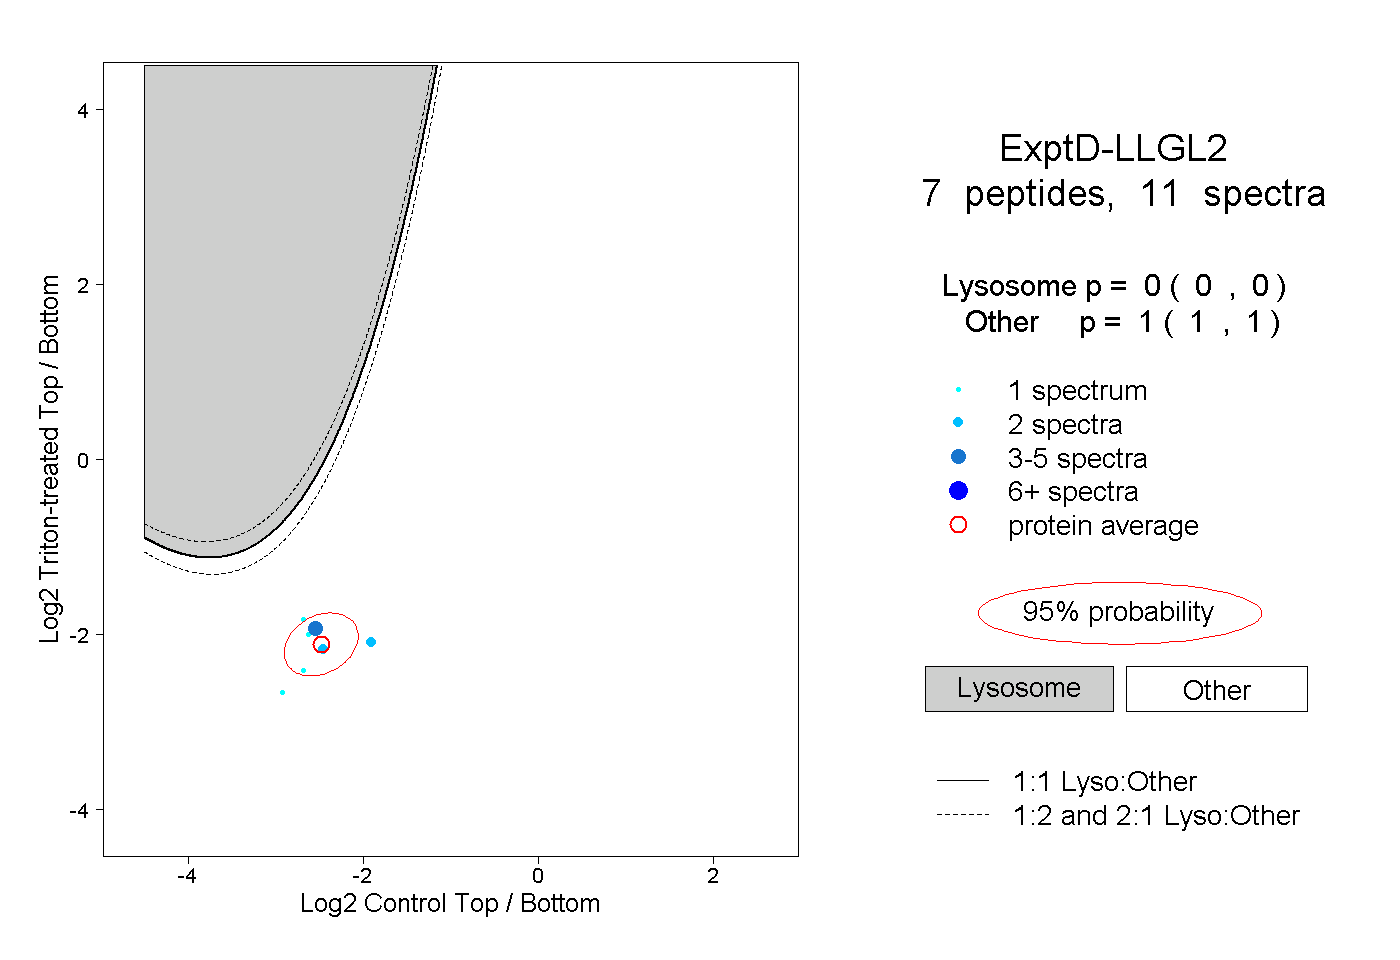
0.000 | 0.000
1.000 | 1.000