 29
29peptides
spectra
0.000 | 0.000
0.000 | 0.000
0.099 | 0.106
0.208 | 0.226
0.000 | 0.006
0.586 | 0.601
0.081 | 0.085
0.000 | 0.000
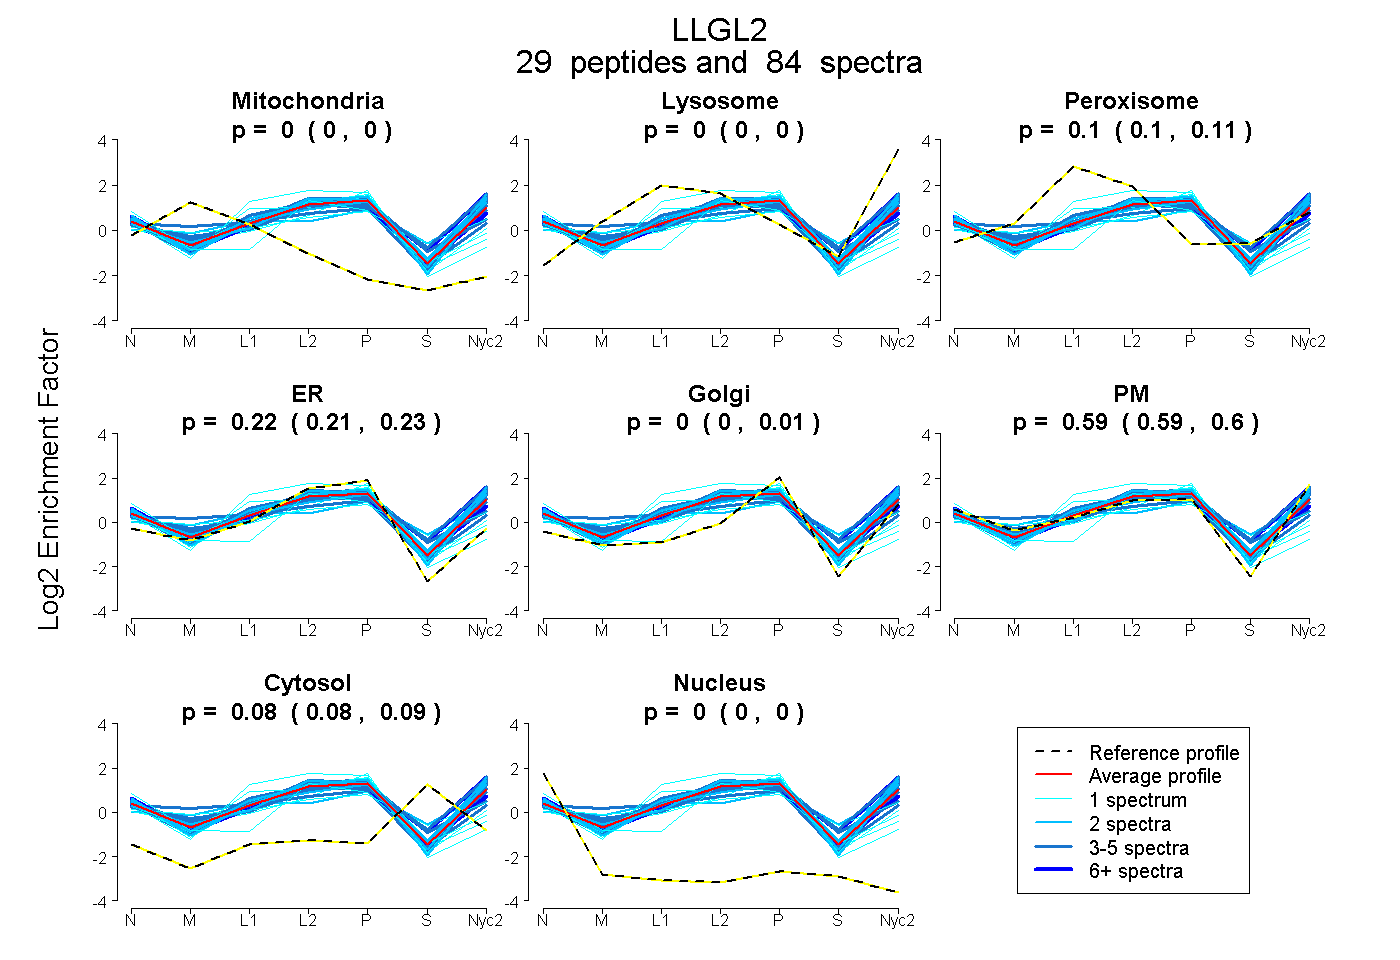
| Plot | Mito | Lyso | Perox | ER | Golgi | PM | Cytosol | Nucleus | |||||
| Expt A |
29 peptides |
84 spectra |
|
0.000 0.000 | 0.000 |
0.000 0.000 | 0.000 |
0.102 0.099 | 0.106 |
0.219 0.208 | 0.226 |
0.000 0.000 | 0.006 |
0.595 0.586 | 0.601 |
0.084 0.081 | 0.085 |
0.000 0.000 | 0.000 |
| 1 spectrum, EVQSTLEGDQGSCGNWR | 0.000 | 0.150 | 0.087 | 0.312 | 0.000 | 0.452 | 0.000 | 0.000 | ||
| 4 spectra, LPGFCALHDR | 0.000 | 0.000 | 0.139 | 0.359 | 0.000 | 0.341 | 0.162 | 0.000 | ||
| 2 spectra, WLVEPR | 0.000 | 0.042 | 0.007 | 0.231 | 0.000 | 0.695 | 0.025 | 0.000 | ||
| 4 spectra, ILAIGTR | 0.000 | 0.070 | 0.041 | 0.182 | 0.000 | 0.685 | 0.022 | 0.000 | ||
| 4 spectra, LTALEGSR | 0.000 | 0.067 | 0.005 | 0.184 | 0.000 | 0.687 | 0.057 | 0.000 | ||
| 9 spectra, IIAAGSR | 0.000 | 0.144 | 0.018 | 0.094 | 0.000 | 0.598 | 0.146 | 0.000 | ||
| 2 spectra, YGQGFYLISPSEFER | 0.000 | 0.000 | 0.052 | 0.085 | 0.000 | 0.741 | 0.123 | 0.000 | ||
| 3 spectra, DLLLTGHEDGTVR | 0.000 | 0.082 | 0.066 | 0.245 | 0.000 | 0.586 | 0.021 | 0.000 | ||
| 3 spectra, LLALTGR | 0.000 | 0.013 | 0.116 | 0.118 | 0.000 | 0.687 | 0.066 | 0.000 | ||
| 4 spectra, FWDASGVCLR | 0.000 | 0.000 | 0.108 | 0.446 | 0.000 | 0.358 | 0.088 | 0.000 | ||
| 1 spectrum, EDVSGIASCVFTK | 0.000 | 0.000 | 0.202 | 0.698 | 0.000 | 0.011 | 0.039 | 0.049 | ||
| 3 spectra, SAEDSFTGFVR | 0.000 | 0.050 | 0.057 | 0.119 | 0.000 | 0.765 | 0.009 | 0.000 | ||
| 1 spectrum, YSCIR | 0.000 | 0.000 | 0.000 | 0.445 | 0.000 | 0.345 | 0.135 | 0.074 | ||
| 2 spectra, TLYFADTYLR | 0.000 | 0.041 | 0.067 | 0.096 | 0.000 | 0.756 | 0.040 | 0.000 | ||
| 1 spectrum, ADEPVR | 0.000 | 0.128 | 0.024 | 0.113 | 0.000 | 0.689 | 0.045 | 0.000 | ||
| 1 spectrum, CTLHPSDQLALEGPLSR | 0.092 | 0.000 | 0.000 | 0.740 | 0.098 | 0.000 | 0.049 | 0.021 | ||
| 4 spectra, FSLSTK | 0.000 | 0.063 | 0.000 | 0.171 | 0.030 | 0.664 | 0.071 | 0.000 | ||
| 6 spectra, LAARPGPVR | 0.000 | 0.000 | 0.105 | 0.253 | 0.000 | 0.529 | 0.112 | 0.000 | ||
| 1 spectrum, TISSDEVLQWLPEEAR | 0.000 | 0.093 | 0.055 | 0.222 | 0.099 | 0.531 | 0.000 | 0.000 | ||
| 4 spectra, GLVVIWDLR | 0.000 | 0.046 | 0.032 | 0.235 | 0.000 | 0.657 | 0.031 | 0.000 | ||
| 4 spectra, TGLQNMELAPVQR | 0.000 | 0.133 | 0.093 | 0.024 | 0.000 | 0.601 | 0.149 | 0.000 | ||
| 1 spectrum, LVAFGTSHGFGLFDHQQR | 0.002 | 0.000 | 0.257 | 0.051 | 0.205 | 0.288 | 0.196 | 0.000 | ||
| 2 spectra, VFEMVEALQEHPR | 0.000 | 0.125 | 0.011 | 0.188 | 0.000 | 0.586 | 0.091 | 0.000 | ||
| 2 spectra, ASYGDR | 0.000 | 0.015 | 0.311 | 0.000 | 0.283 | 0.241 | 0.150 | 0.000 | ||
| 5 spectra, EIQLMHR | 0.000 | 0.000 | 0.131 | 0.179 | 0.107 | 0.501 | 0.082 | 0.000 | ||
| 1 spectrum, SPDMQGSHQLLVVSEEQFK | 0.000 | 0.004 | 0.323 | 0.017 | 0.374 | 0.282 | 0.000 | 0.000 | ||
| 4 spectra, DLFQFNK | 0.000 | 0.008 | 0.056 | 0.193 | 0.000 | 0.686 | 0.058 | 0.000 | ||
| 4 spectra, DPNQILIGYSR | 0.070 | 0.000 | 0.177 | 0.000 | 0.194 | 0.559 | 0.000 | 0.000 | ||
| 1 spectrum, SSVPYGPFPCK | 0.000 | 0.000 | 0.075 | 0.562 | 0.000 | 0.271 | 0.064 | 0.028 |
| Plot | Mito | Lyso or Perox | ER | Golgi | PM | Cytosol | Nucleus | ||||||
| Expt B |
12 peptides |
26 spectra |
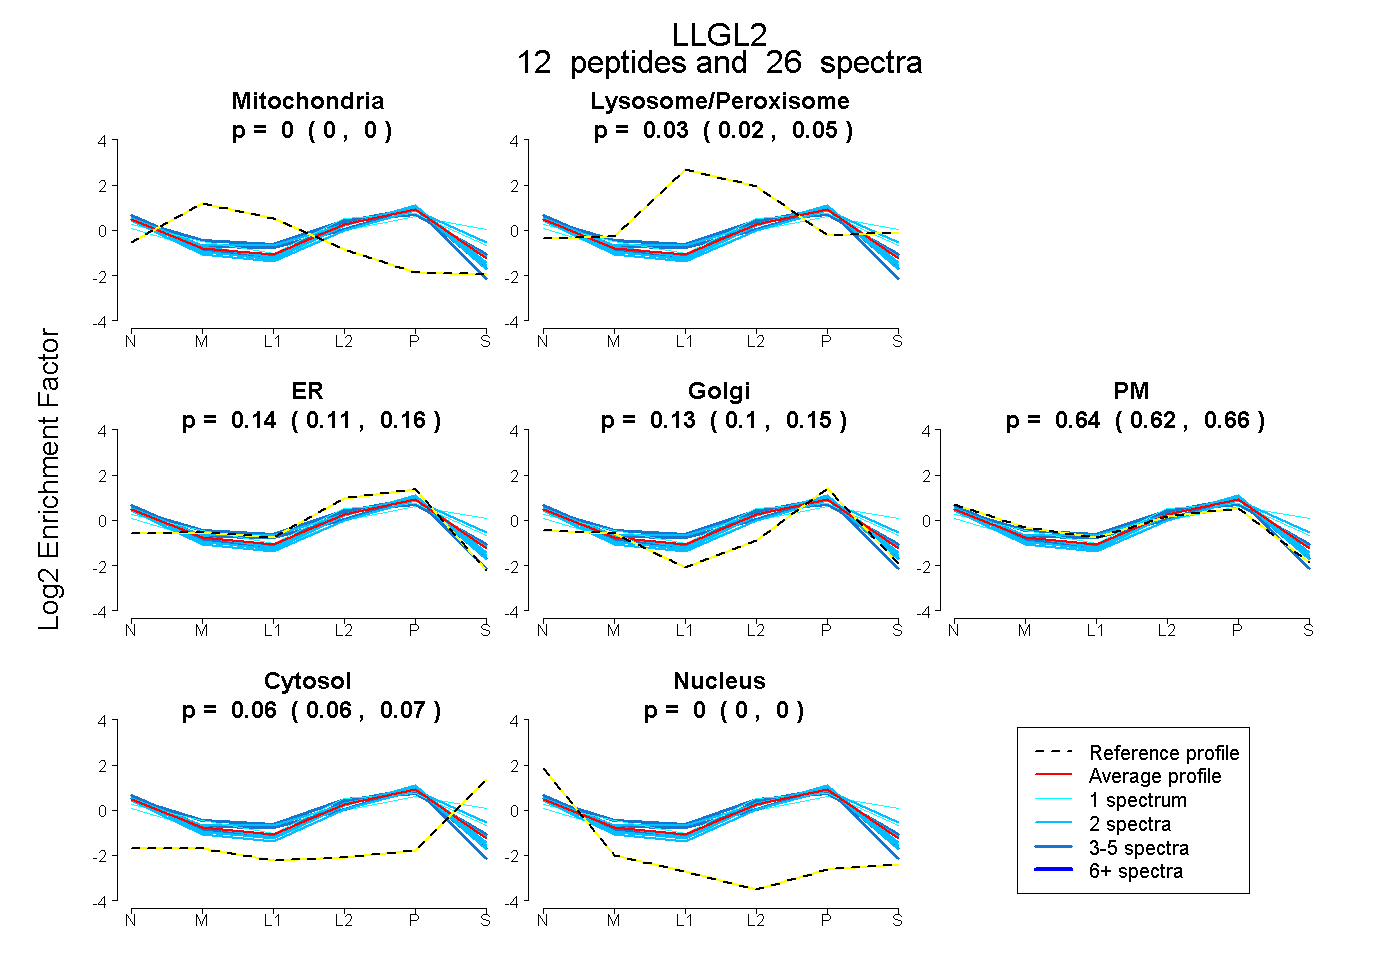 |
0.000 0.000 | 0.000 |
0.034 0.016 | 0.047 |
0.135 0.106 | 0.159 |
0.127 0.096 | 0.151 |
0.640 0.622 | 0.656 |
0.064 0.057 | 0.070 |
0.000 0.000 | 0.000 |
|||
| Plot | Lyso | Other | |||||||||||
| Expt C |
31 peptides |
131 spectra |
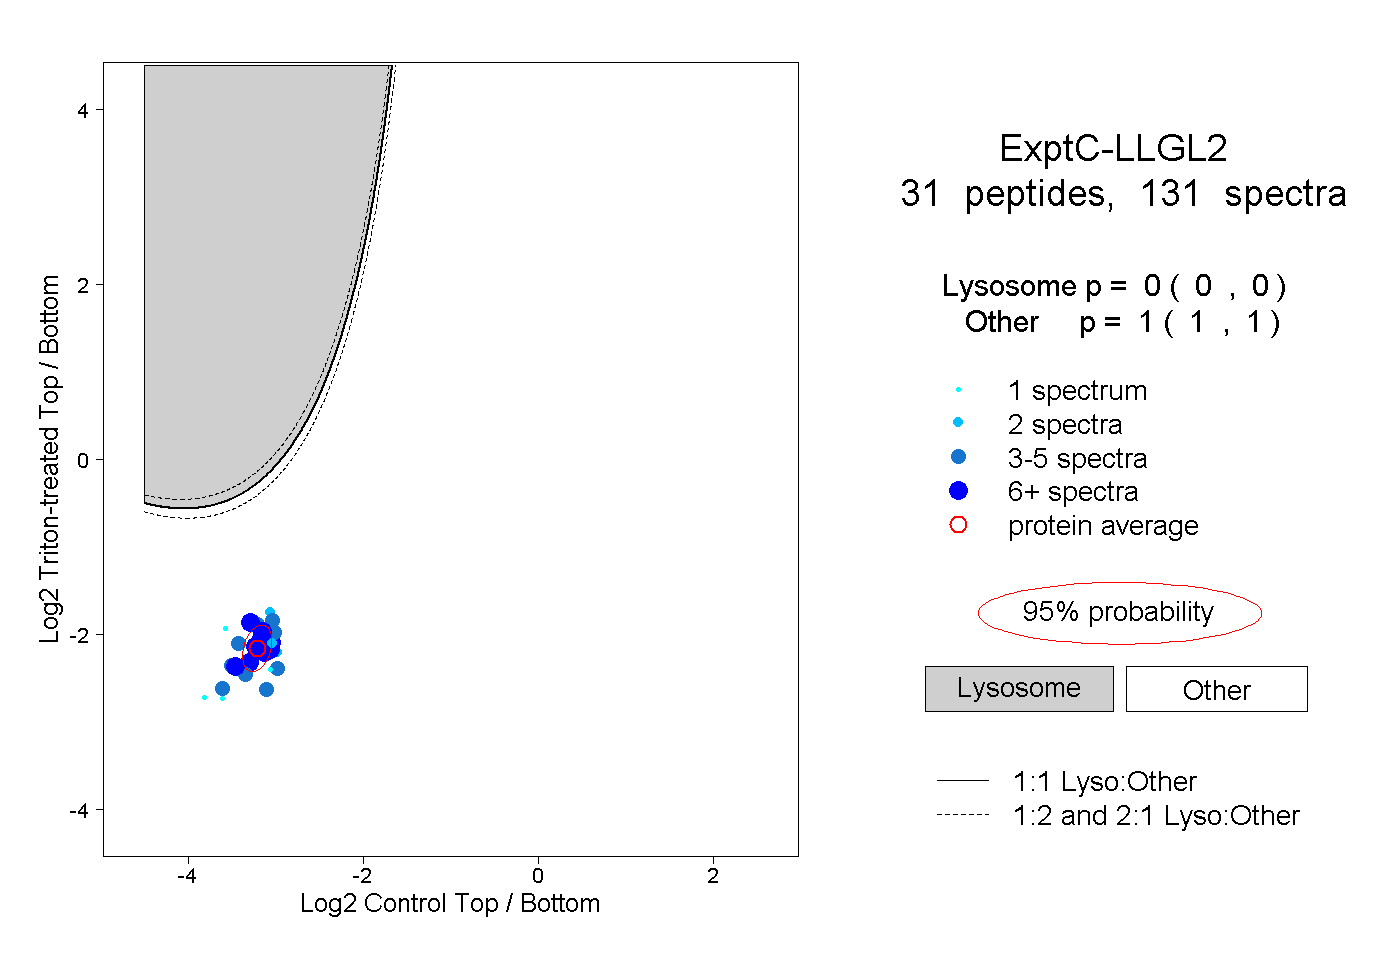 |
0.000 0.000 | 0.000 |
1.000 1.000 | 1.000 |
||||||||
| Plot | Lyso | Other | |||||||||||
| Expt D |
7 peptides |
11 spectra |
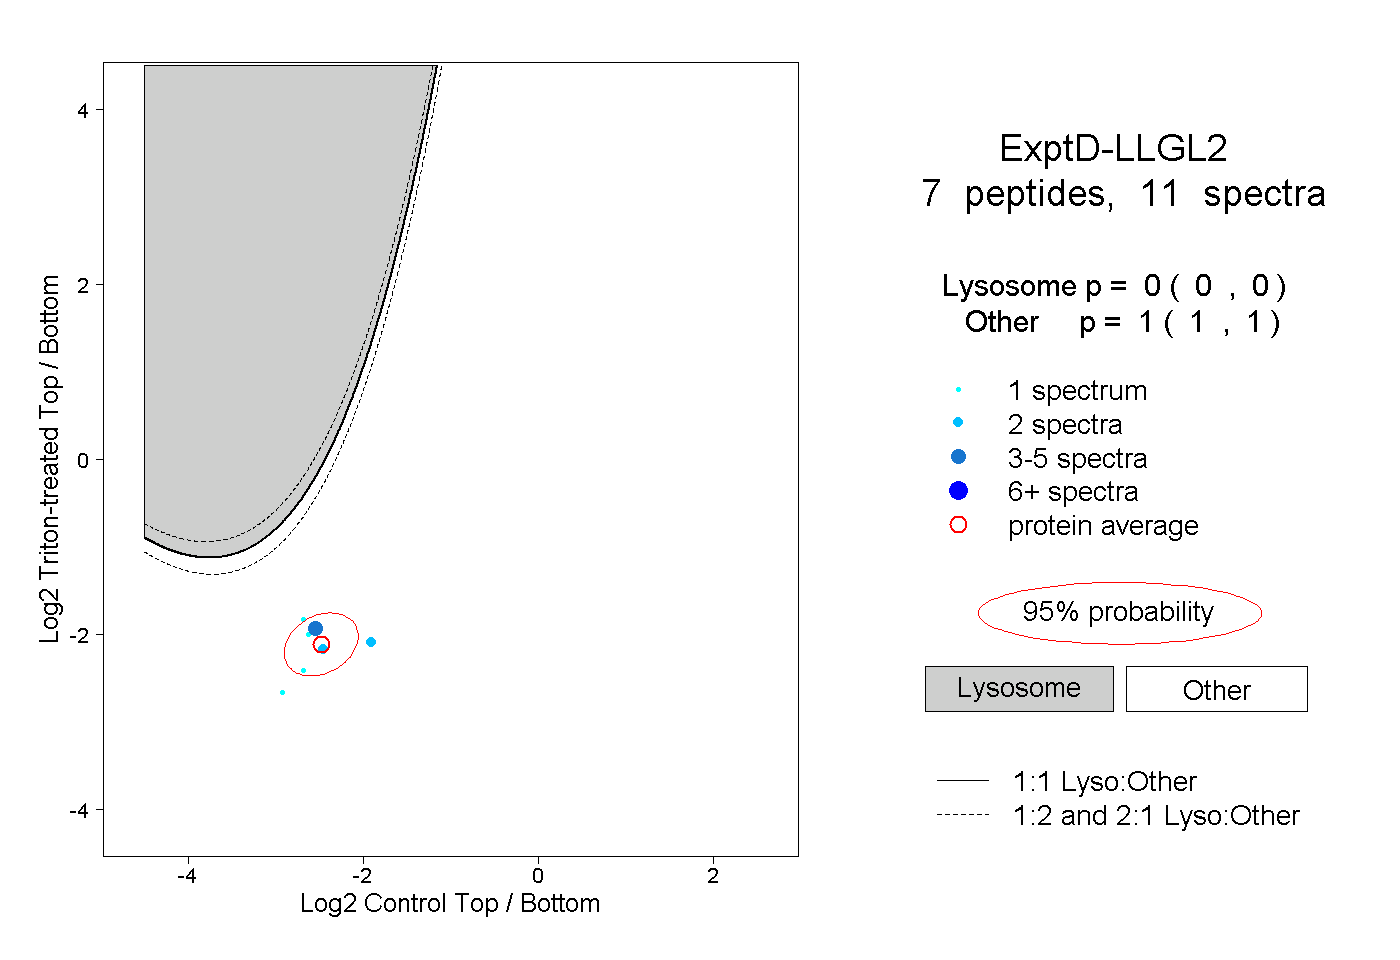 |
0.000 0.000 | 0.000 |
1.000 1.000 | 1.000 |