 5
5peptides
spectra
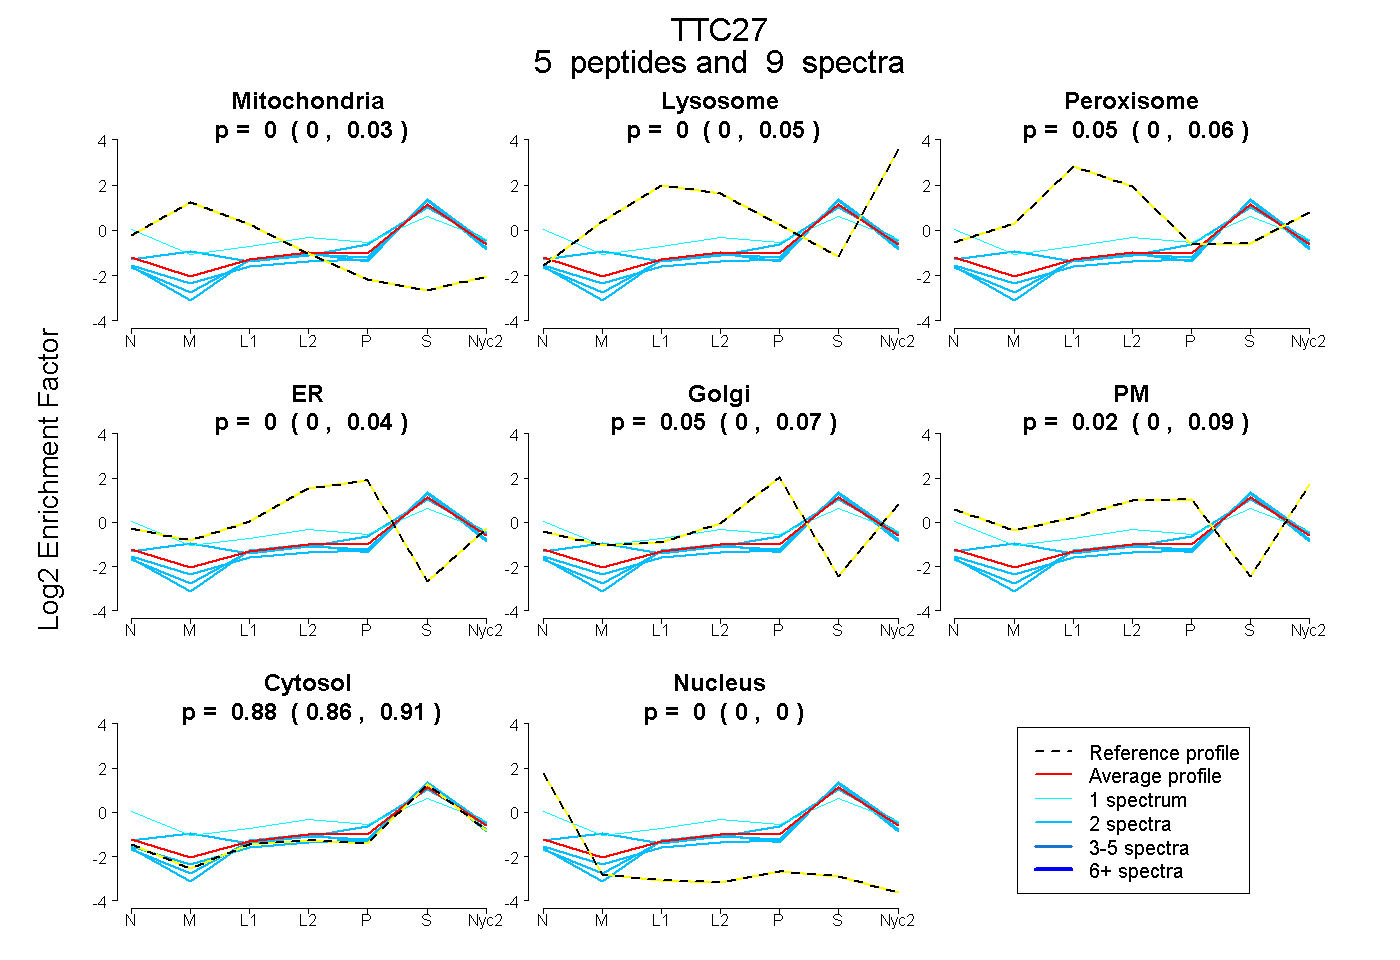
0.000 | 0.025
0.000 | 0.050
0.000 | 0.057
0.000 | 0.044
0.000 | 0.074
0.000 | 0.091
0.855 | 0.908
0.000 | 0.000
1peptide
spectrum
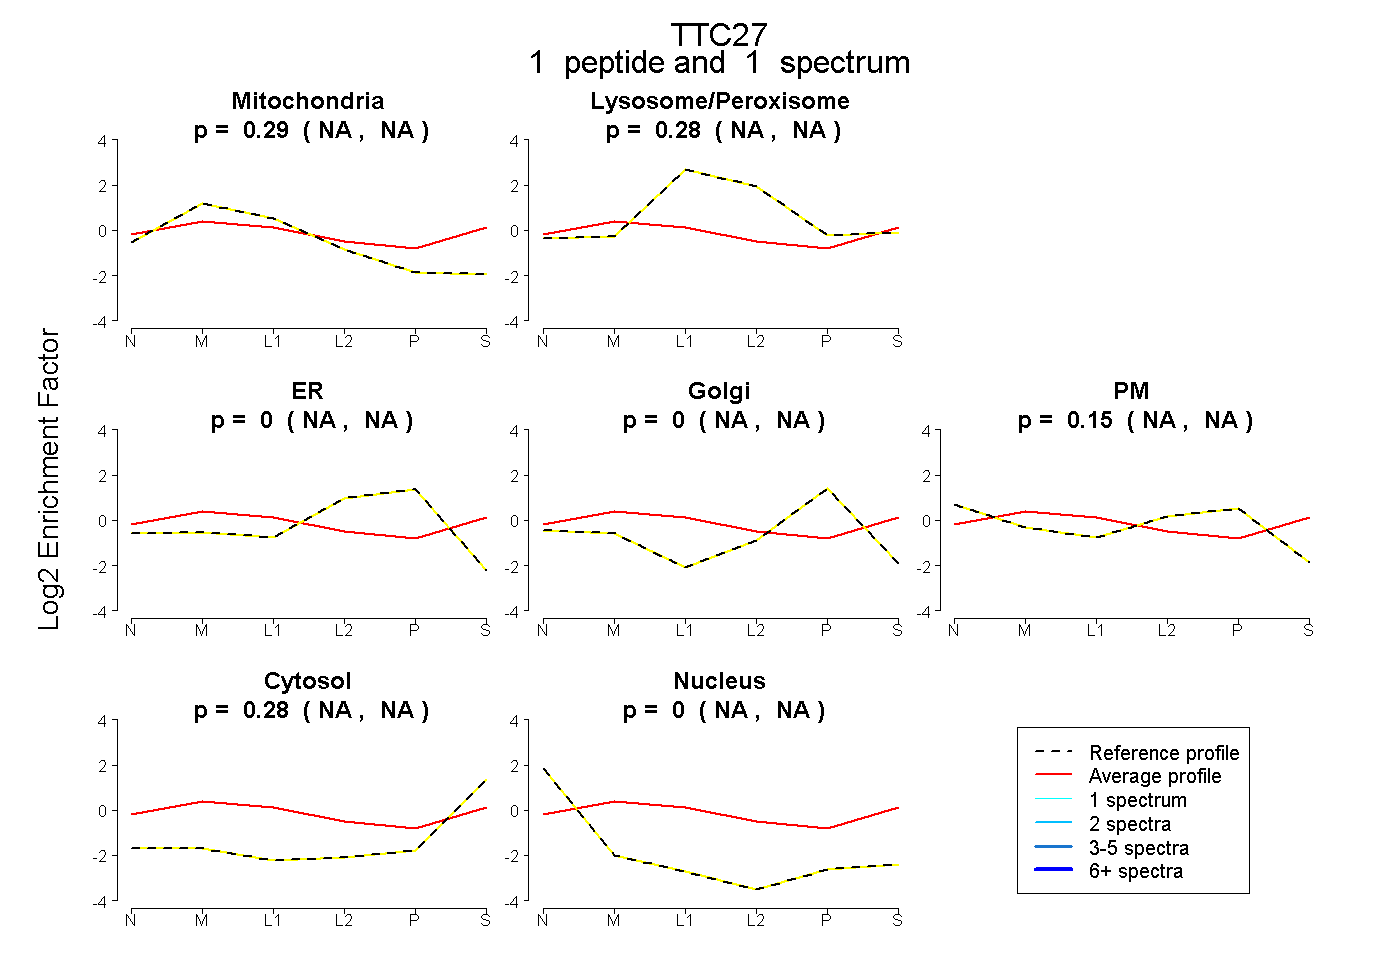
NA | NA
NA | NA
NA | NA
NA | NA
NA | NA
NA | NA
NA | NA
3peptides
spectra
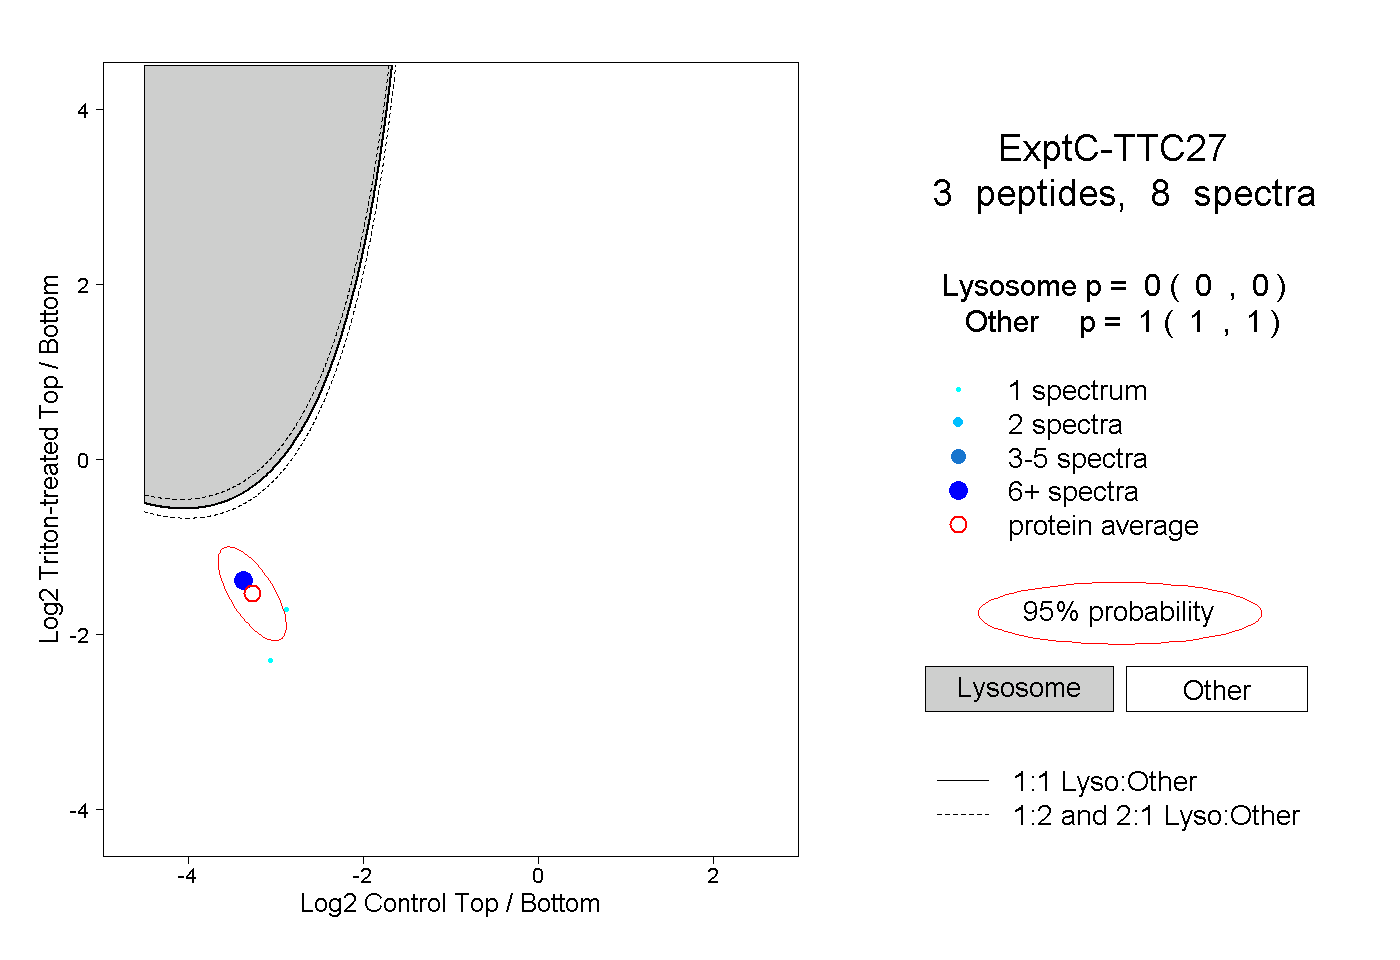
0.000 | 0.000
1.000 | 1.000