 5
5peptides
spectra
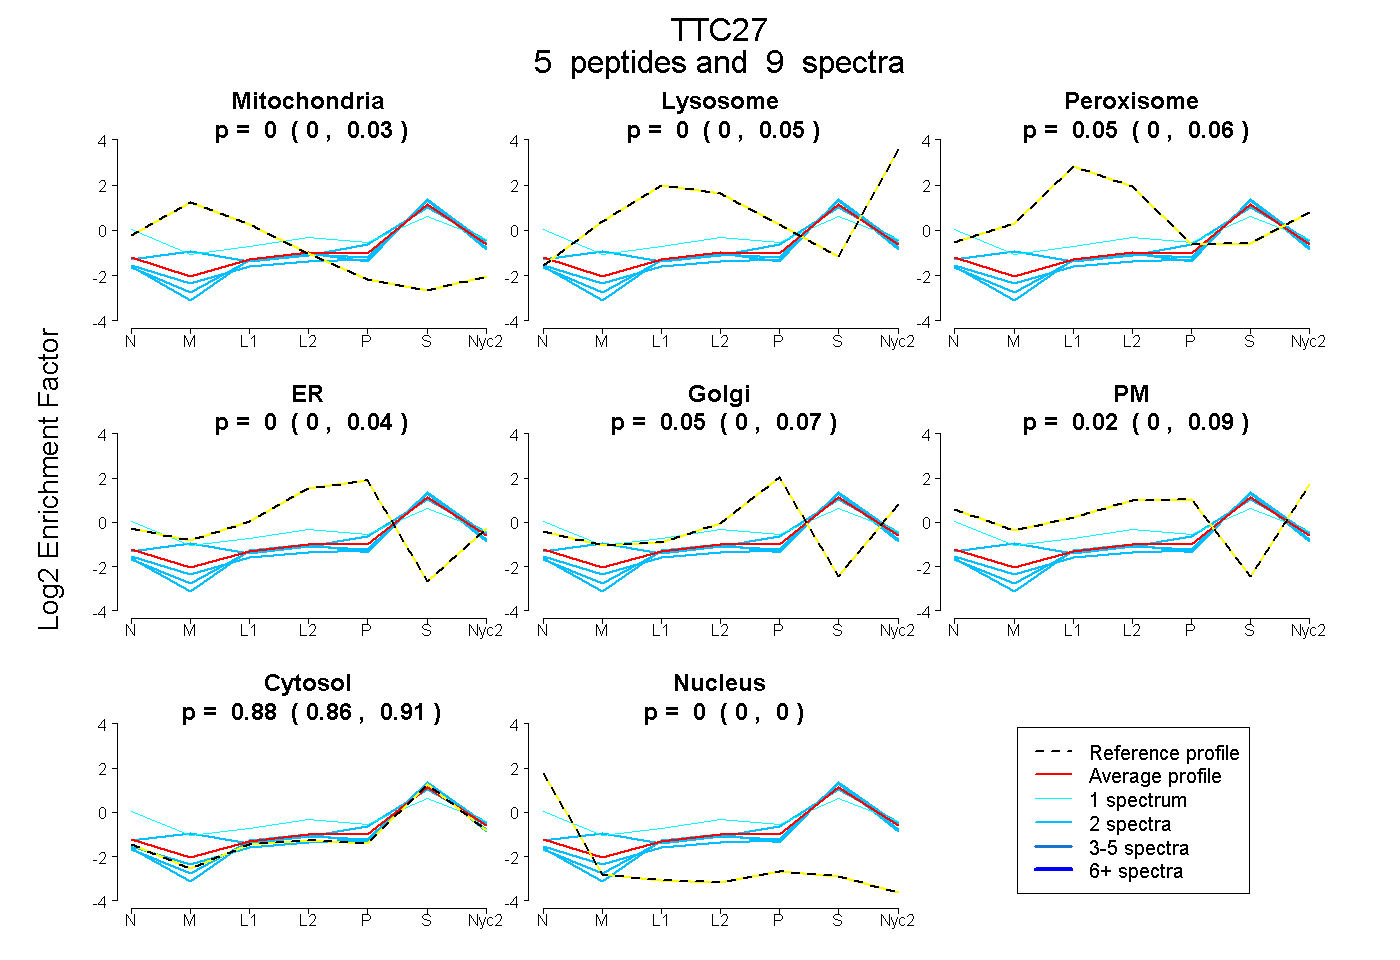
0.000 | 0.025
0.000 | 0.050
0.000 | 0.057
0.000 | 0.044
0.000 | 0.074
0.000 | 0.091
0.855 | 0.908
0.000 | 0.000
| Plot | Mito | Lyso | Perox | ER | Golgi | PM | Cytosol | Nucleus | |||||
| Expt A |
5 peptides |
9 spectra |
|
0.000 0.000 | 0.025 |
0.005 0.000 | 0.050 |
0.045 0.000 | 0.057 |
0.000 0.000 | 0.044 |
0.051 0.000 | 0.074 |
0.018 0.000 | 0.091 |
0.882 0.855 | 0.908 |
0.000 0.000 | 0.000 |
| 2 spectra, GFSTEAER | 0.083 | 0.076 | 0.000 | 0.000 | 0.090 | 0.000 | 0.751 | 0.000 | ||
| 1 spectrum, YVNIHQQLLEER | 0.010 | 0.000 | 0.152 | 0.000 | 0.000 | 0.218 | 0.576 | 0.045 | ||
| 2 spectra, ALLHLR | 0.000 | 0.012 | 0.000 | 0.000 | 0.000 | 0.000 | 0.988 | 0.000 | ||
| 2 spectra, AIGLAHVAIK | 0.001 | 0.000 | 0.000 | 0.000 | 0.002 | 0.000 | 0.996 | 0.000 | ||
| 2 spectra, ECVECFER | 0.000 | 0.014 | 0.000 | 0.000 | 0.000 | 0.000 | 0.986 | 0.000 |
| Plot | Mito | Lyso or Perox | ER | Golgi | PM | Cytosol | Nucleus | ||||||
| Expt B |
1 peptide |
1 spectrum |
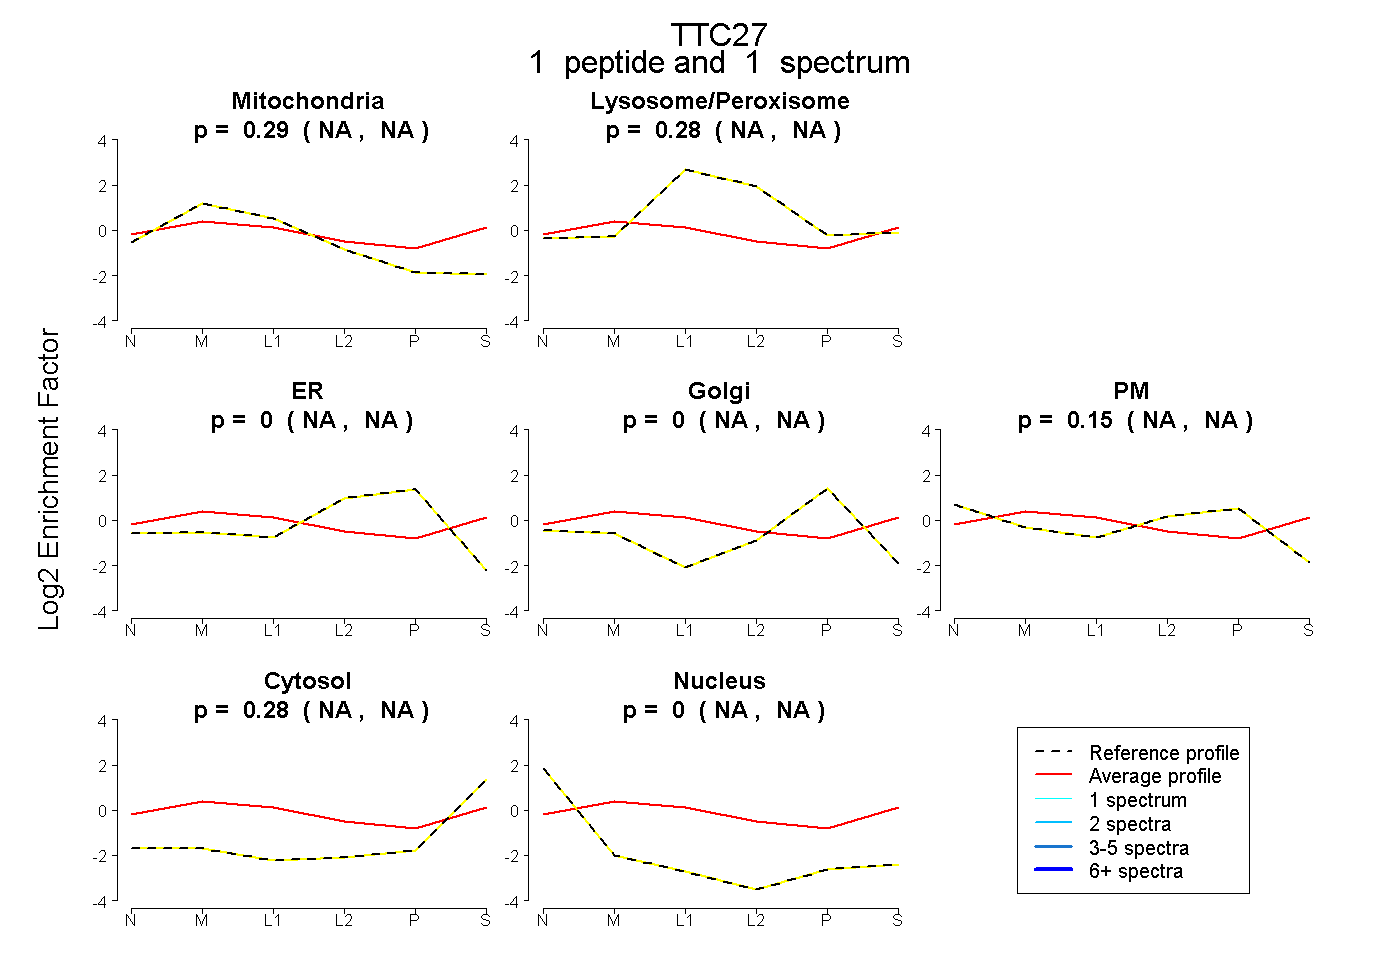 |
0.293 NA | NA |
0.276 NA | NA |
0.000 NA | NA |
0.000 NA | NA |
0.149 NA | NA |
0.281 NA | NA |
0.000 NA | NA |
|||
| Plot | Lyso | Other | |||||||||||
| Expt C |
3 peptides |
8 spectra |
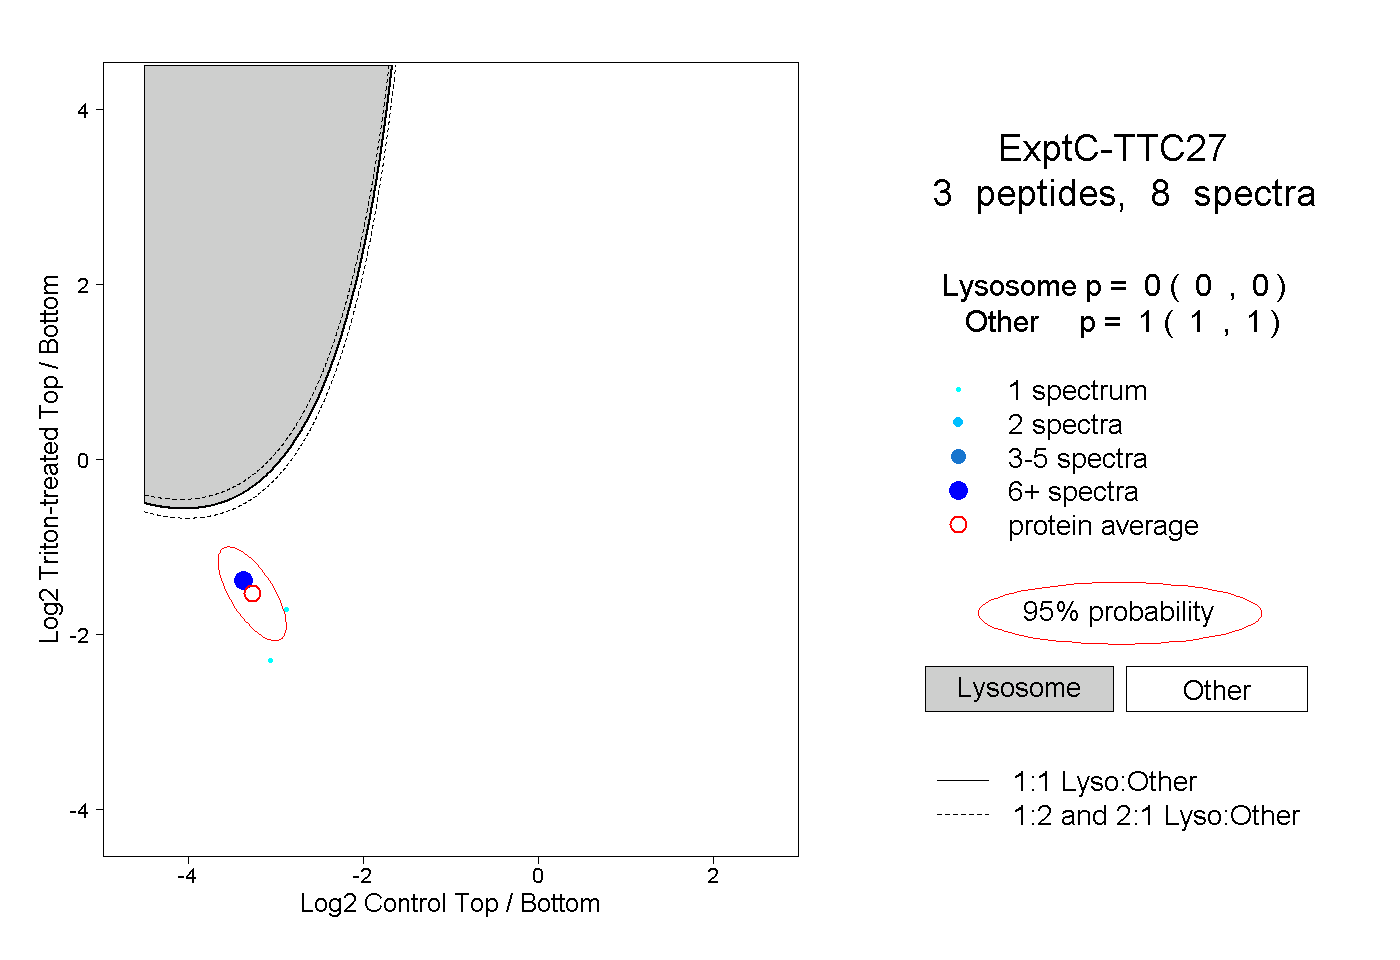 |
0.000 0.000 | 0.000 |
1.000 1.000 | 1.000 |