 12
12peptides
spectra
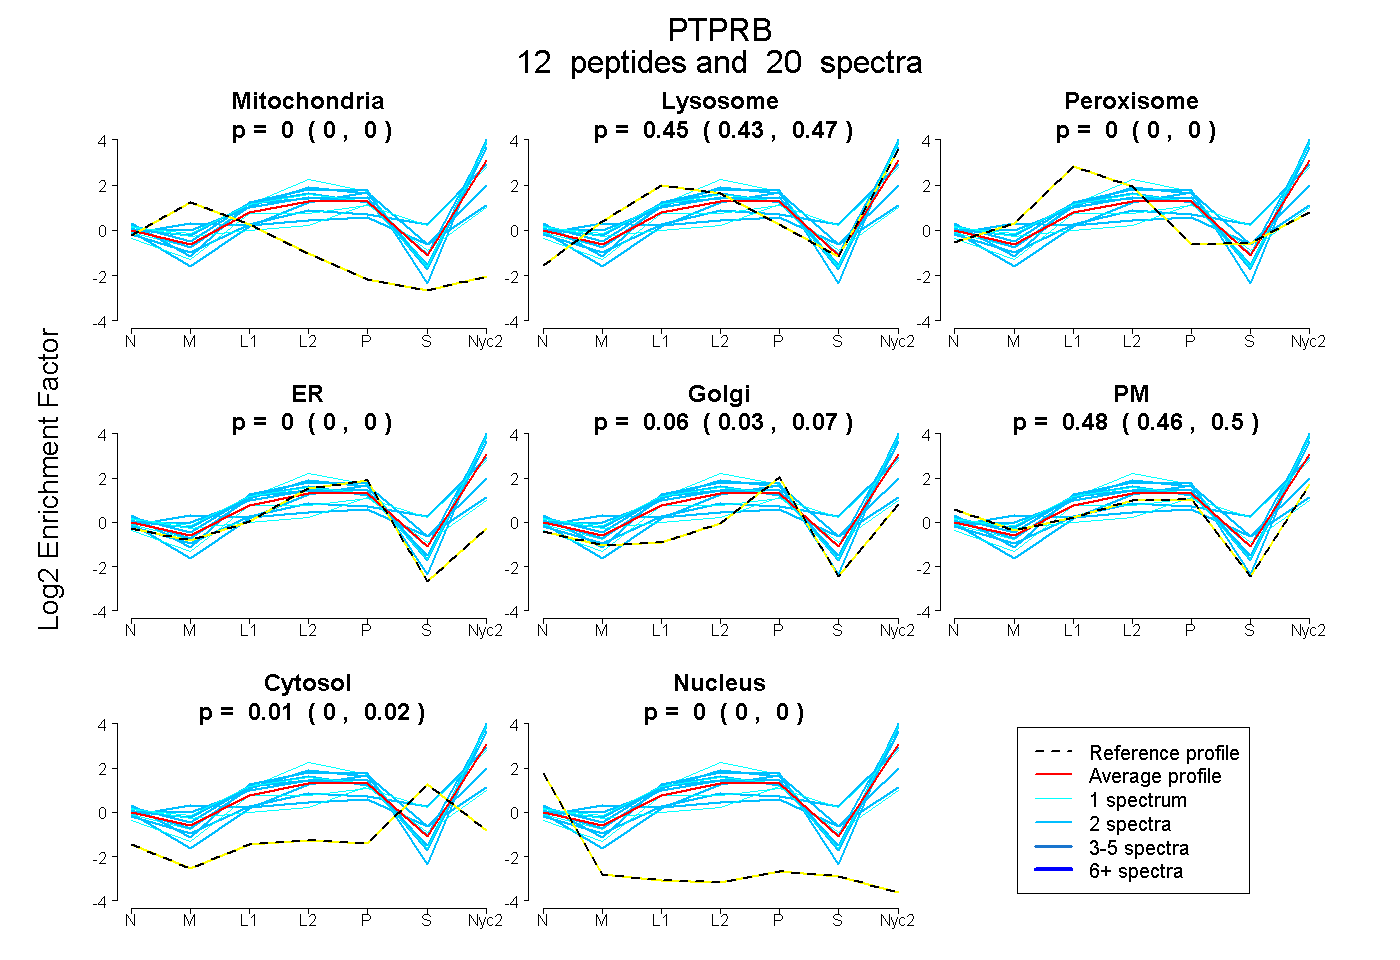
0.000 | 0.000
0.433 | 0.470
0.000 | 0.000
0.000 | 0.000
0.028 | 0.074
0.455 | 0.504
0.000 | 0.023
0.000 | 0.000
19peptides
spectra
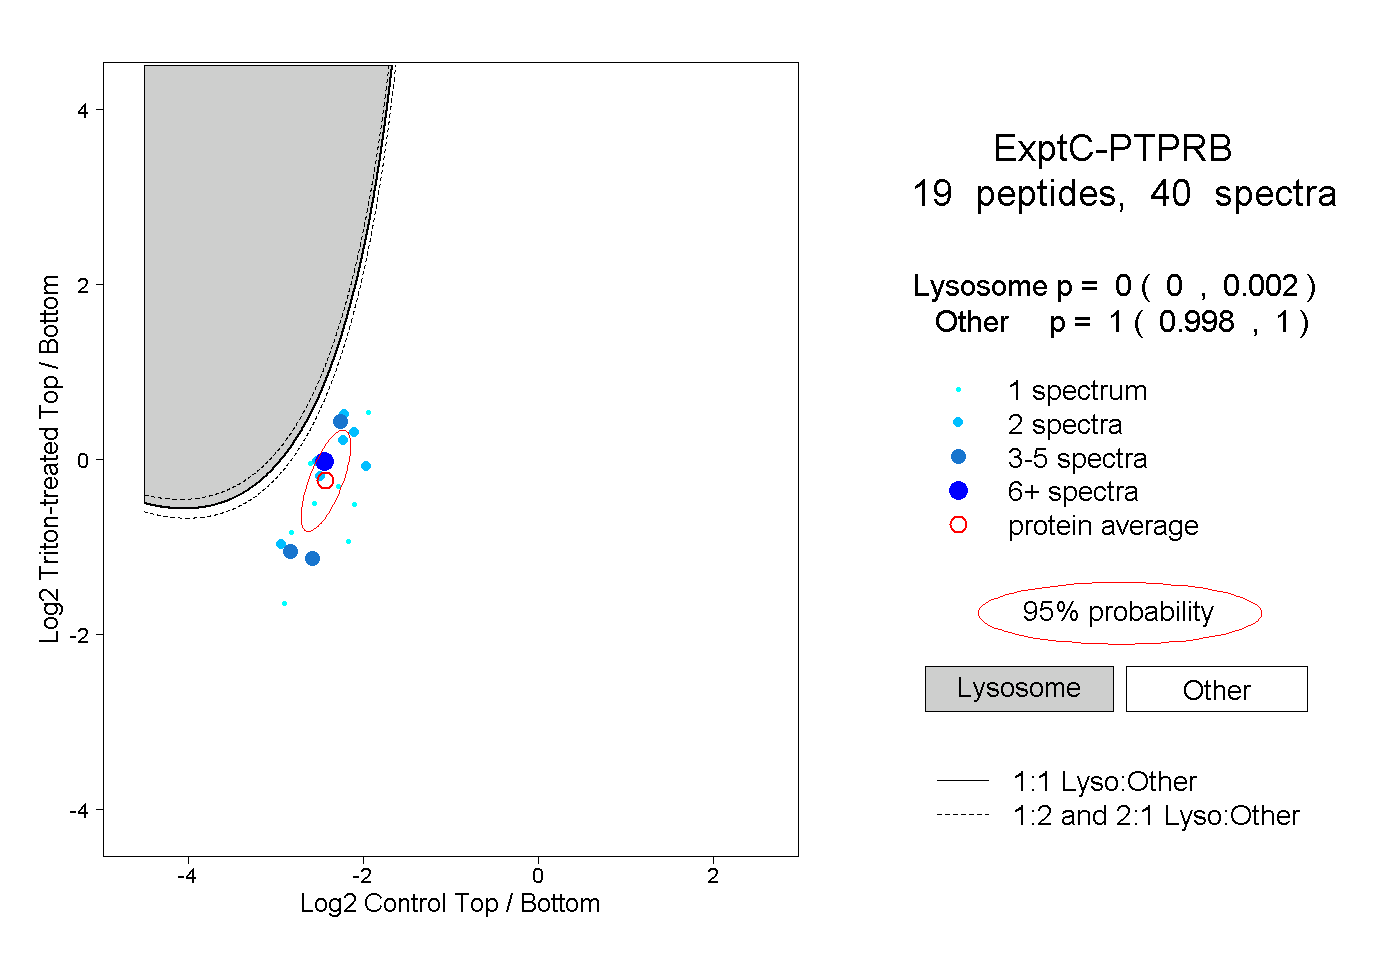
0.000 | 0.002
0.998 | 1.000
2peptides
spectra
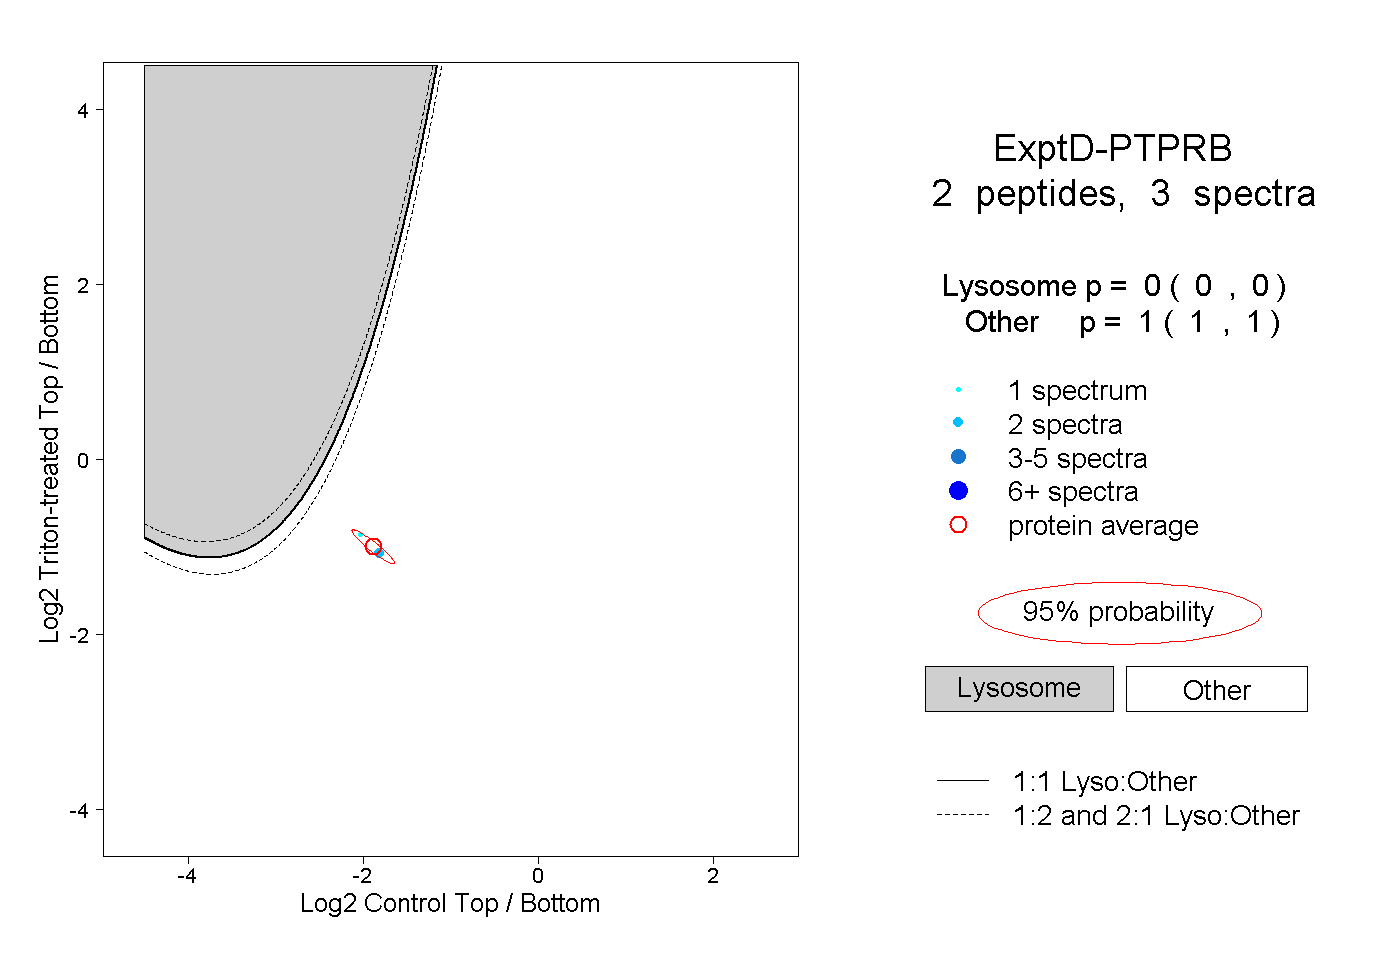
0.000 | 0.000
1.000 | 1.000