 5
5peptides
spectra
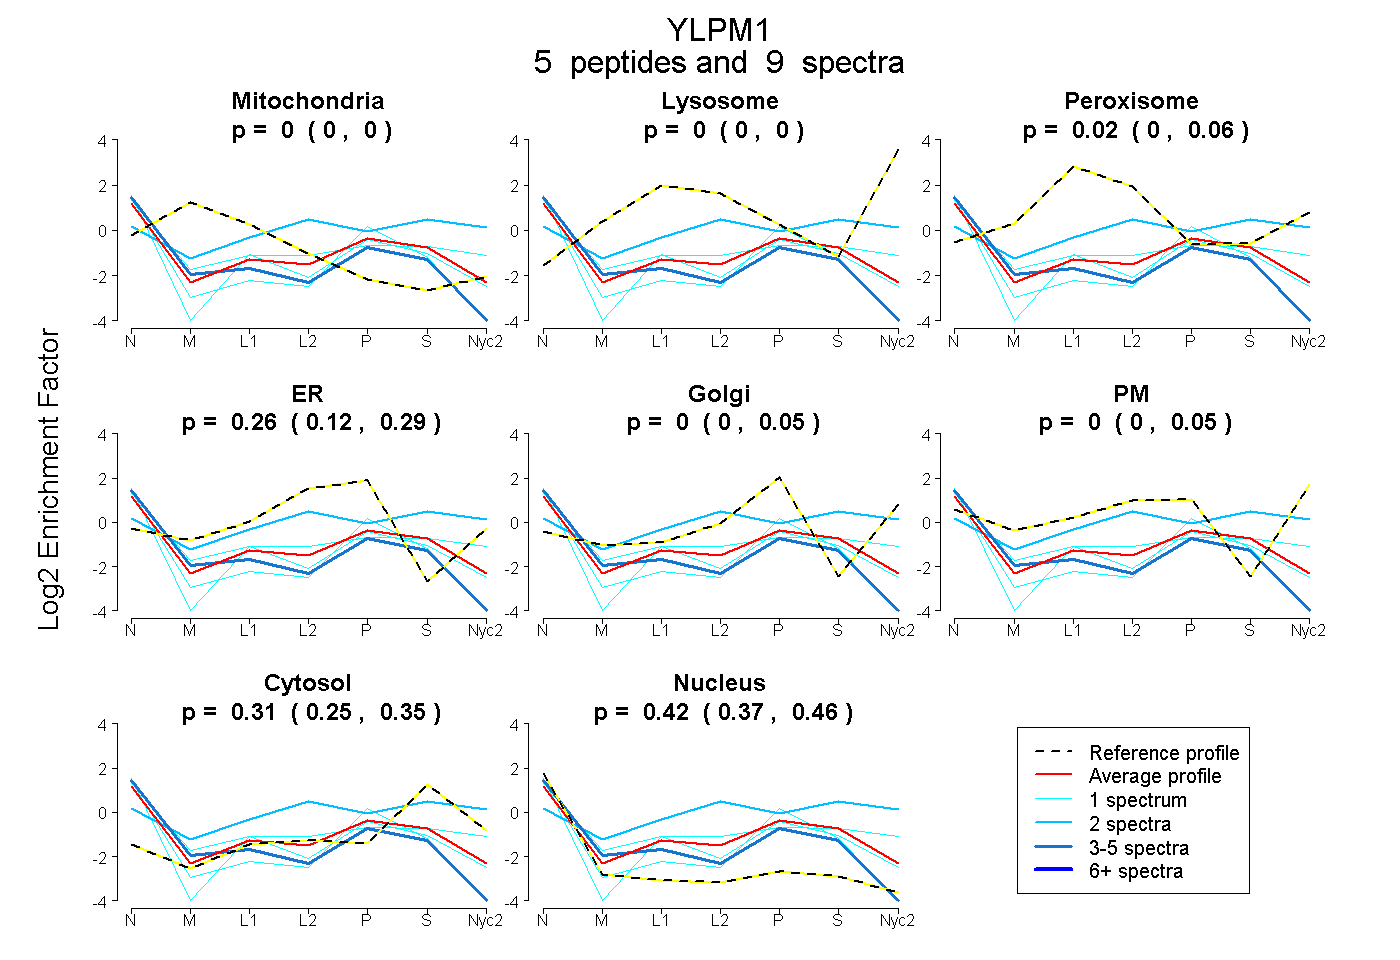
0.000 | 0.000
0.000 | 0.000
0.000 | 0.062
0.123 | 0.286
0.000 | 0.047
0.000 | 0.050
0.251 | 0.346
0.374 | 0.458
1peptide
spectrum
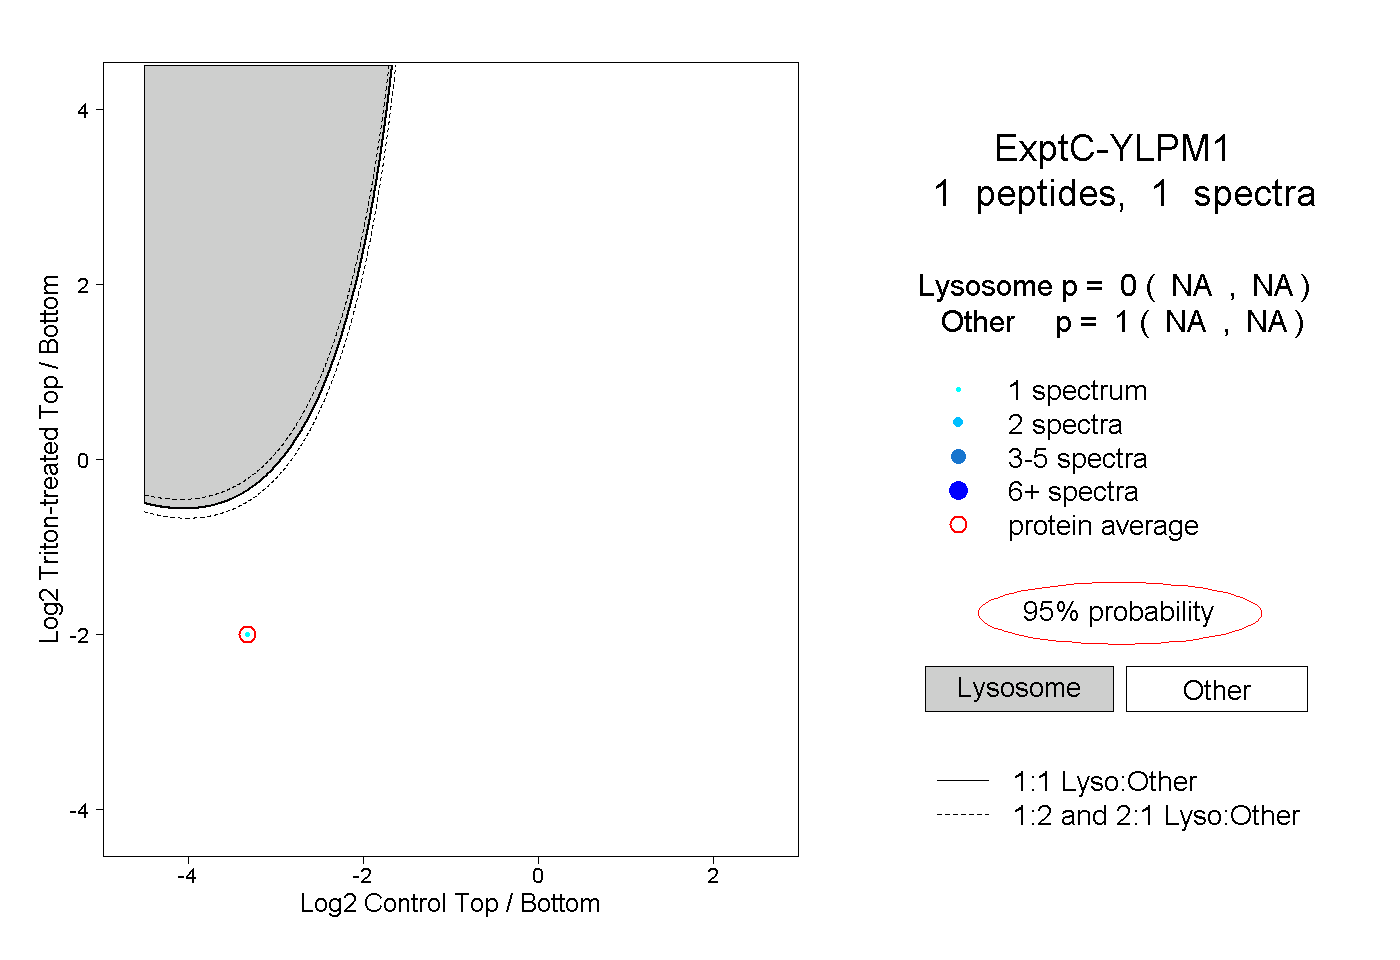
NA | NA
NA | NA
1peptide
spectrum
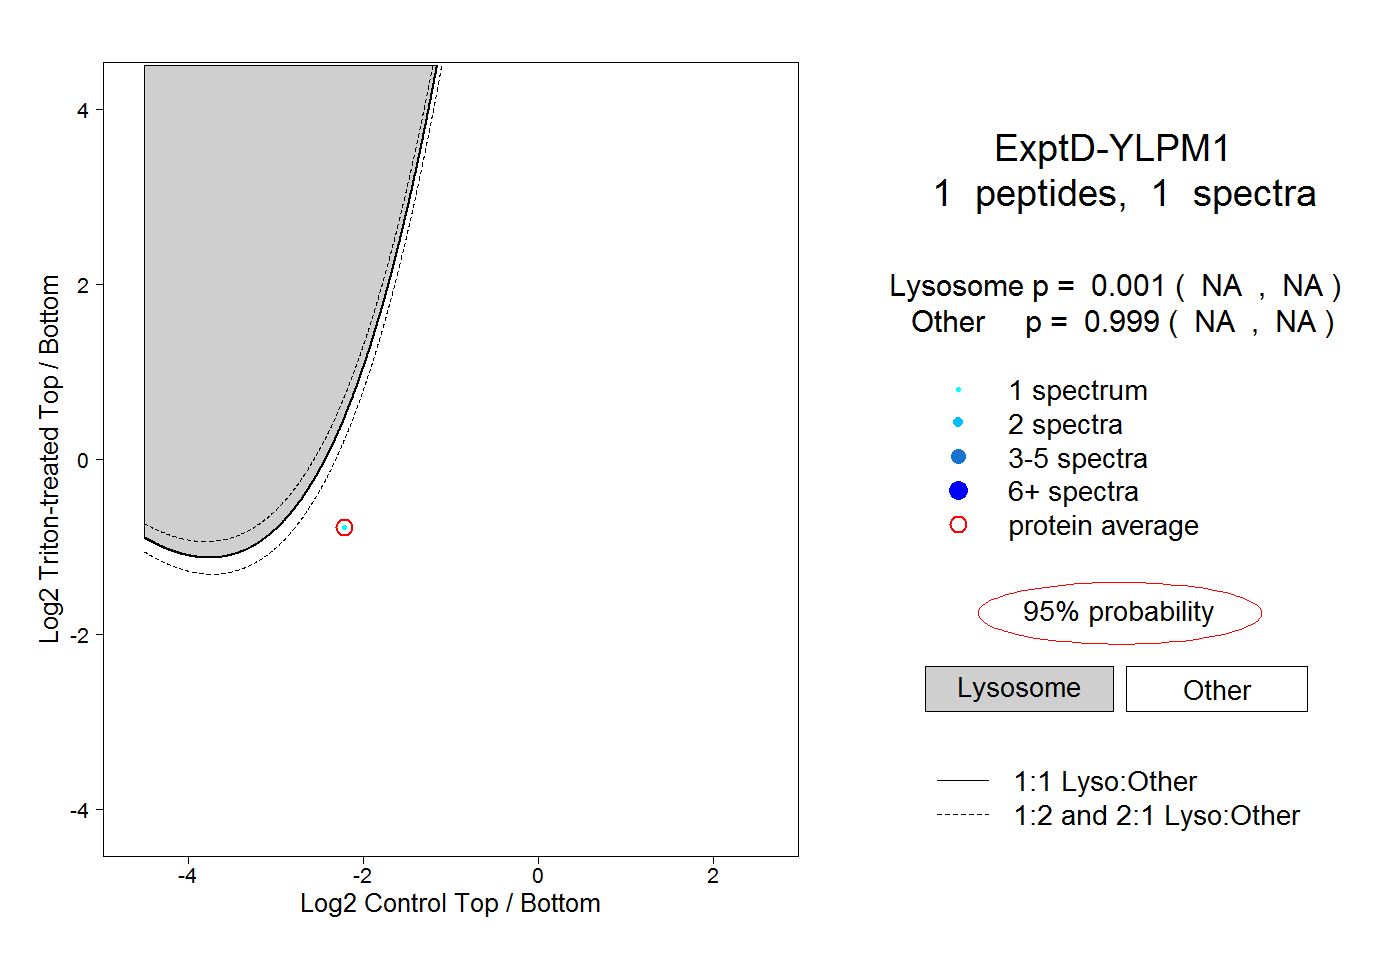
NA | NA
NA | NA