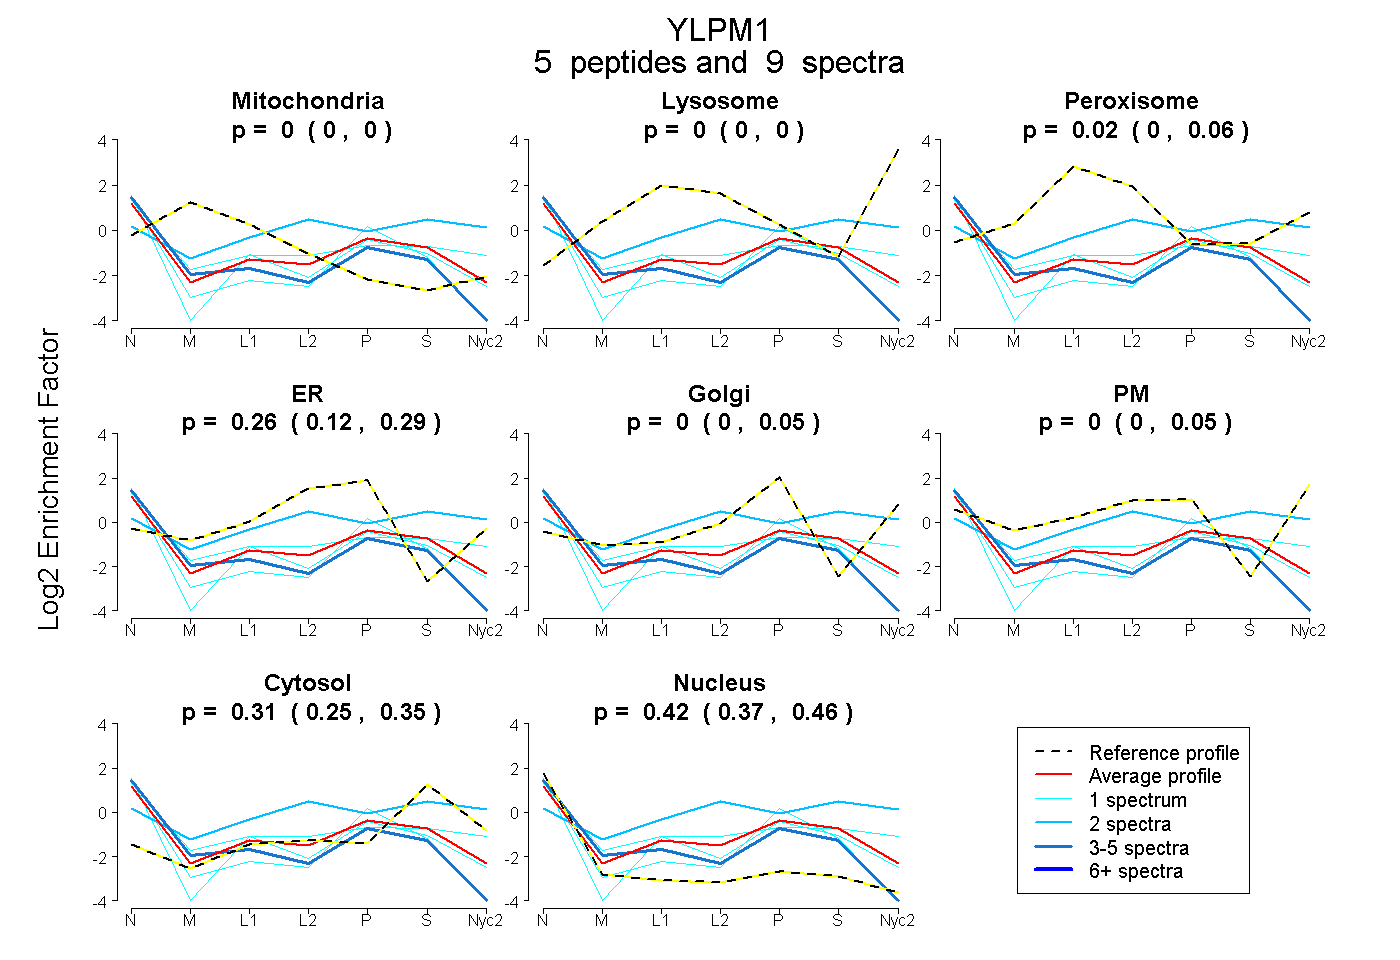
 5
5peptides
spectra
0.000 | 0.000
0.000 | 0.000
0.000 | 0.062
0.123 | 0.286
0.000 | 0.047
0.000 | 0.050
0.251 | 0.346
0.374 | 0.458
| Plot | Mito | Lyso | Perox | ER | Golgi | PM | Cytosol | Nucleus | |||||
| Expt A |
5 peptides |
9 spectra |
|
0.000 0.000 | 0.000 |
0.000 0.000 | 0.000 |
0.016 0.000 | 0.062 |
0.257 0.123 | 0.286 |
0.000 0.000 | 0.047 |
0.000 0.000 | 0.050 |
0.309 0.251 | 0.346 |
0.418 0.374 | 0.458 |
| 4 spectra, WADLEEK | 0.033 | 0.000 | 0.000 | 0.163 | 0.000 | 0.000 | 0.146 | 0.658 | ||
| 2 spectra, VTSFQAVK | 0.000 | 0.000 | 0.186 | 0.008 | 0.000 | 0.320 | 0.486 | 0.000 | ||
| 1 spectrum, ITLRPDPLPER | 0.000 | 0.000 | 0.000 | 0.167 | 0.000 | 0.000 | 0.167 | 0.665 | ||
| 1 spectrum, TTIQQEPLETGAK | 0.000 | 0.000 | 0.081 | 0.000 | 0.000 | 0.288 | 0.281 | 0.350 | ||
| 1 spectrum, AIGFVVGQTDWEK | 0.000 | 0.000 | 0.000 | 0.178 | 0.000 | 0.000 | 0.298 | 0.524 |
| Plot | Lyso | Other | |||||||||||
| Expt C |
1 peptide |
1 spectrum |
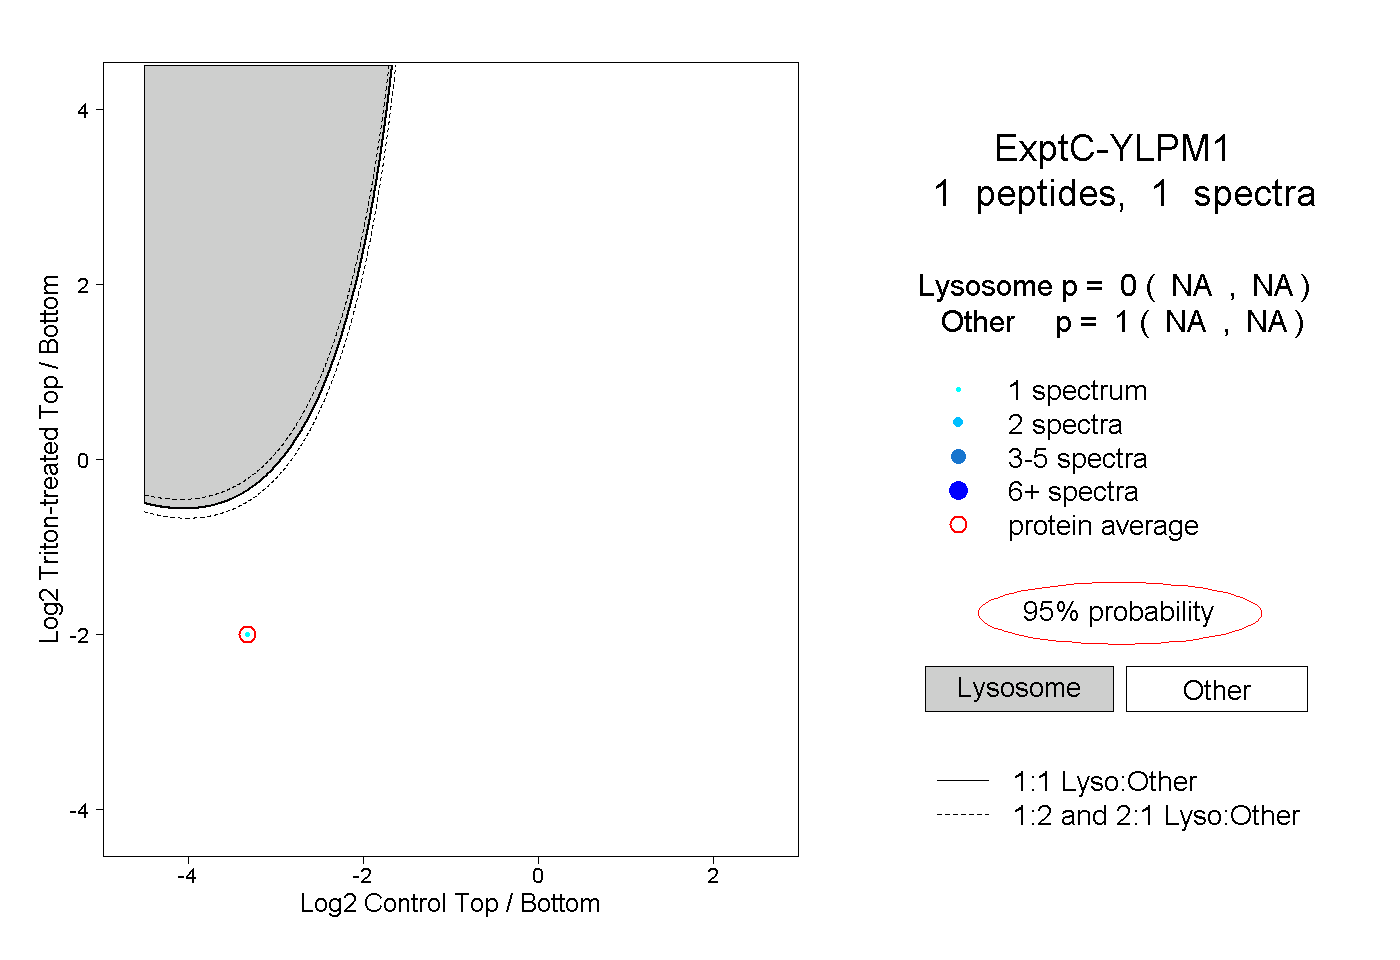 |
0.000 NA | NA |
1.000 NA | NA |
||||||||
| Plot | Lyso | Other | |||||||||||
| Expt D |
1 peptide |
1 spectrum |
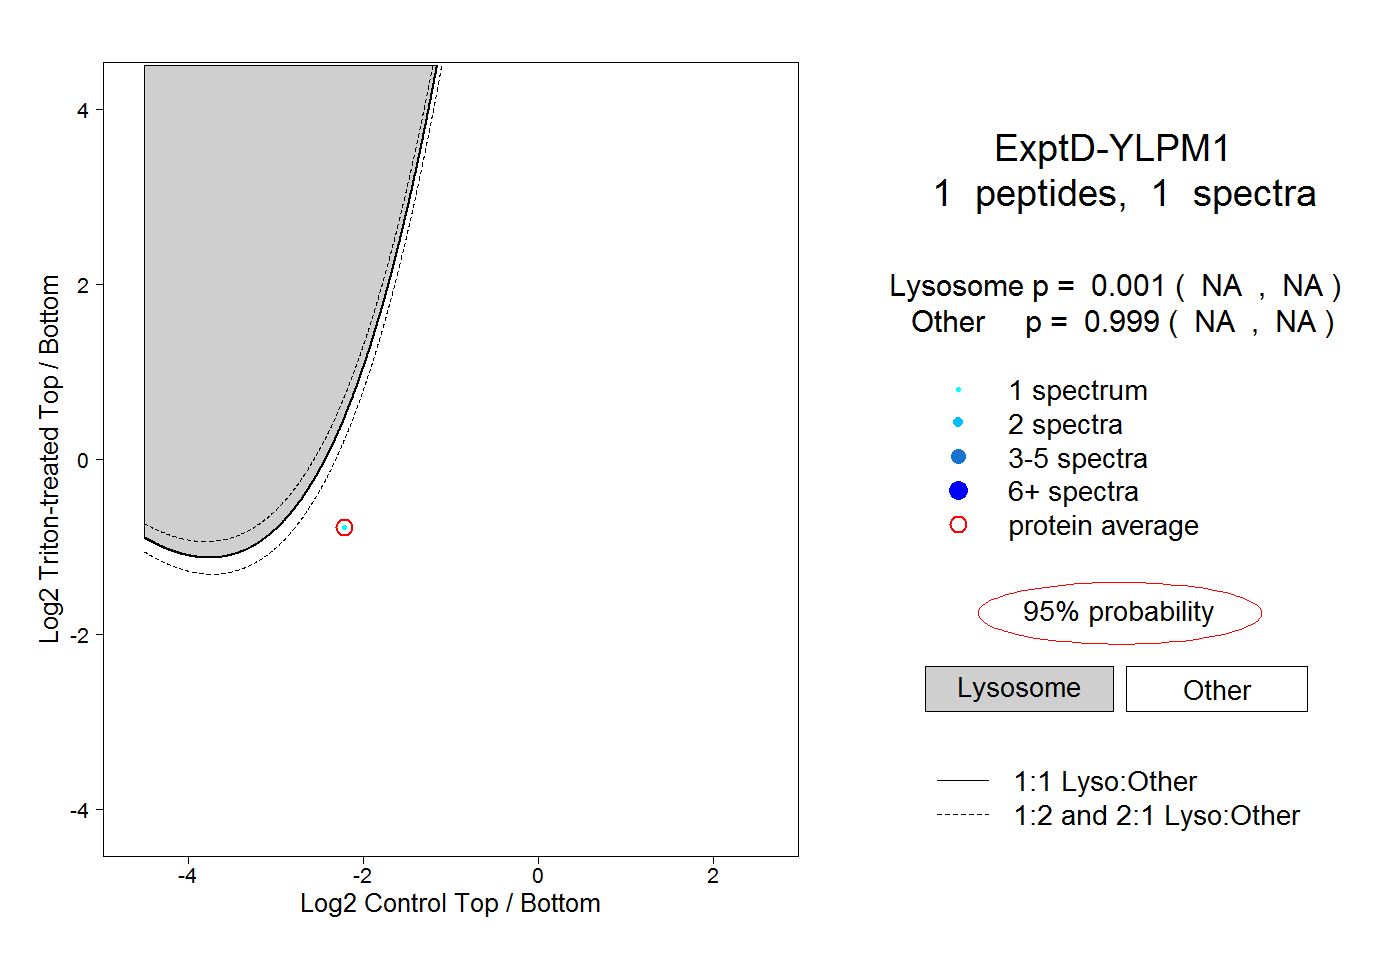 |
0.001 NA | NA |
0.999 NA | NA |