 3
3peptides
spectra
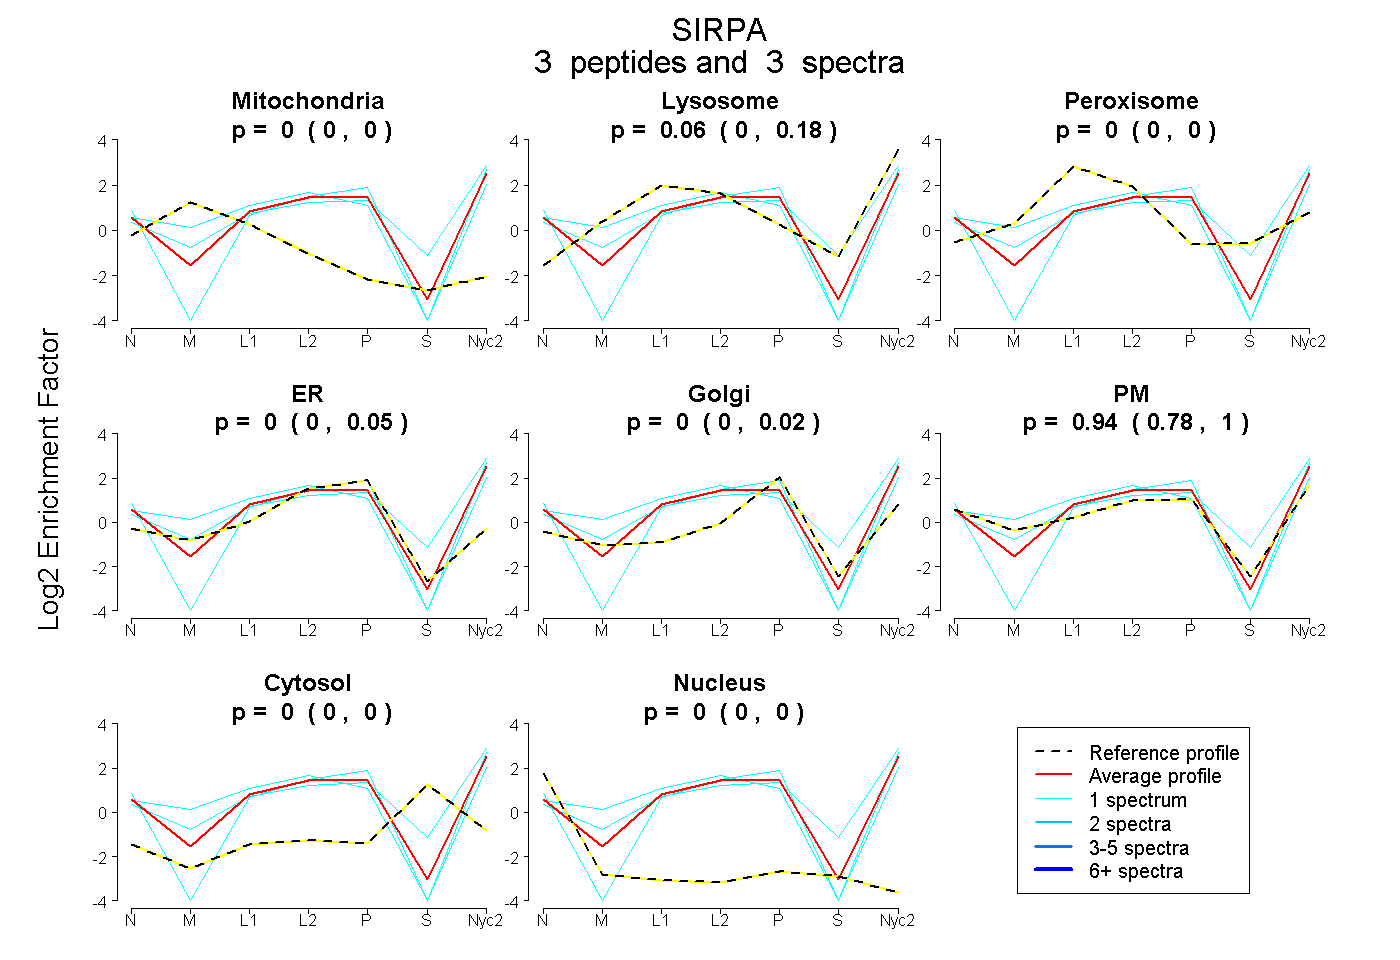
0.000 | 0.000
0.000 | 0.182
0.000 | 0.000
0.000 | 0.052
0.000 | 0.025
0.783 | 1.000
0.000 | 0.000
0.000 | 0.000
7peptides
spectra
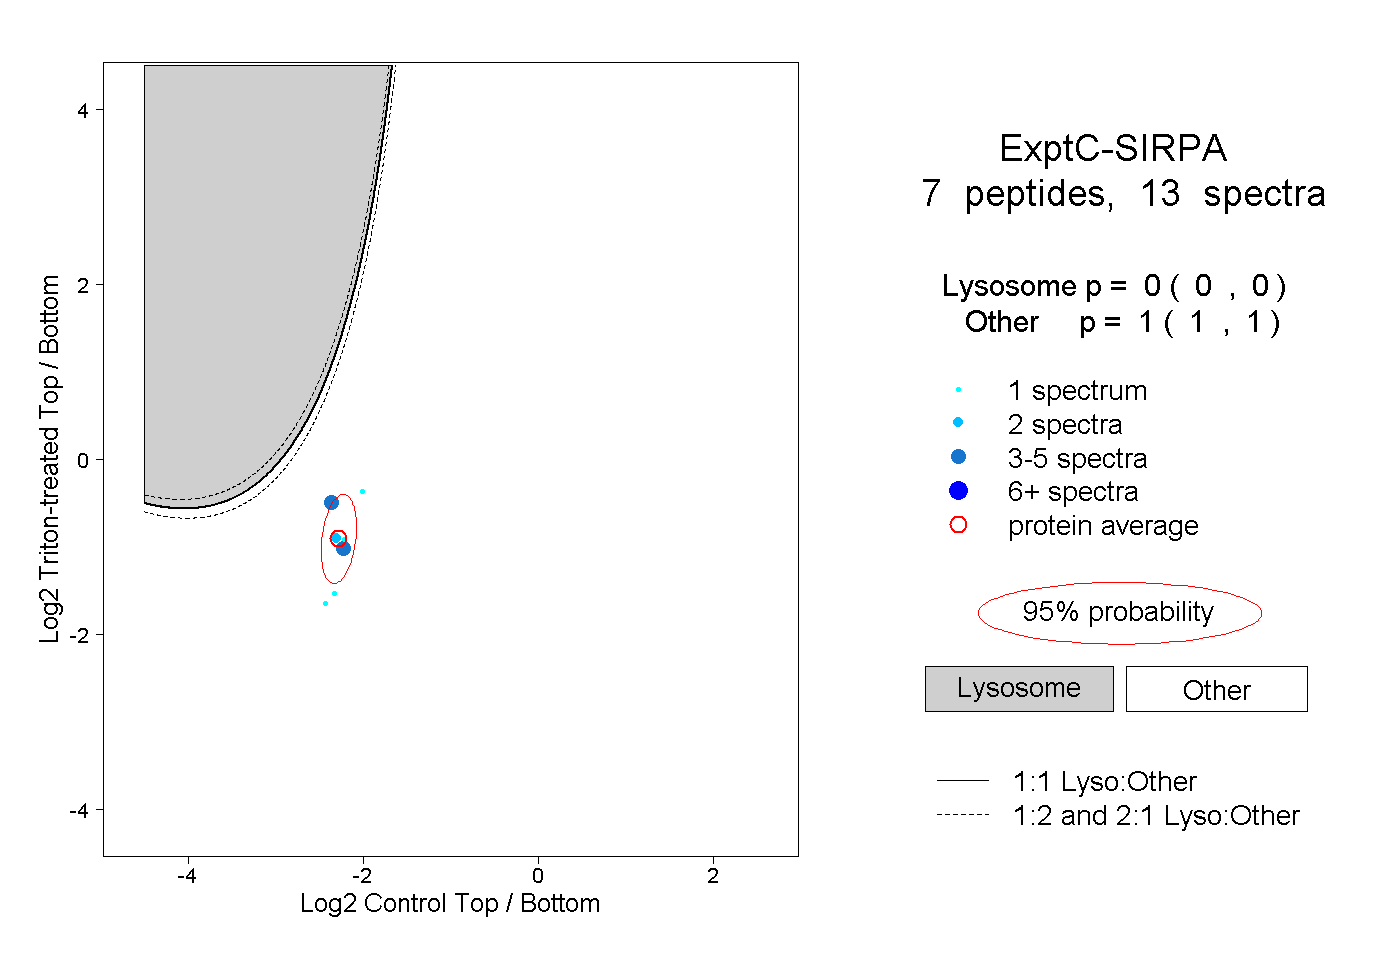
0.000 | 0.000
1.000 | 1.000
1peptide
spectrum
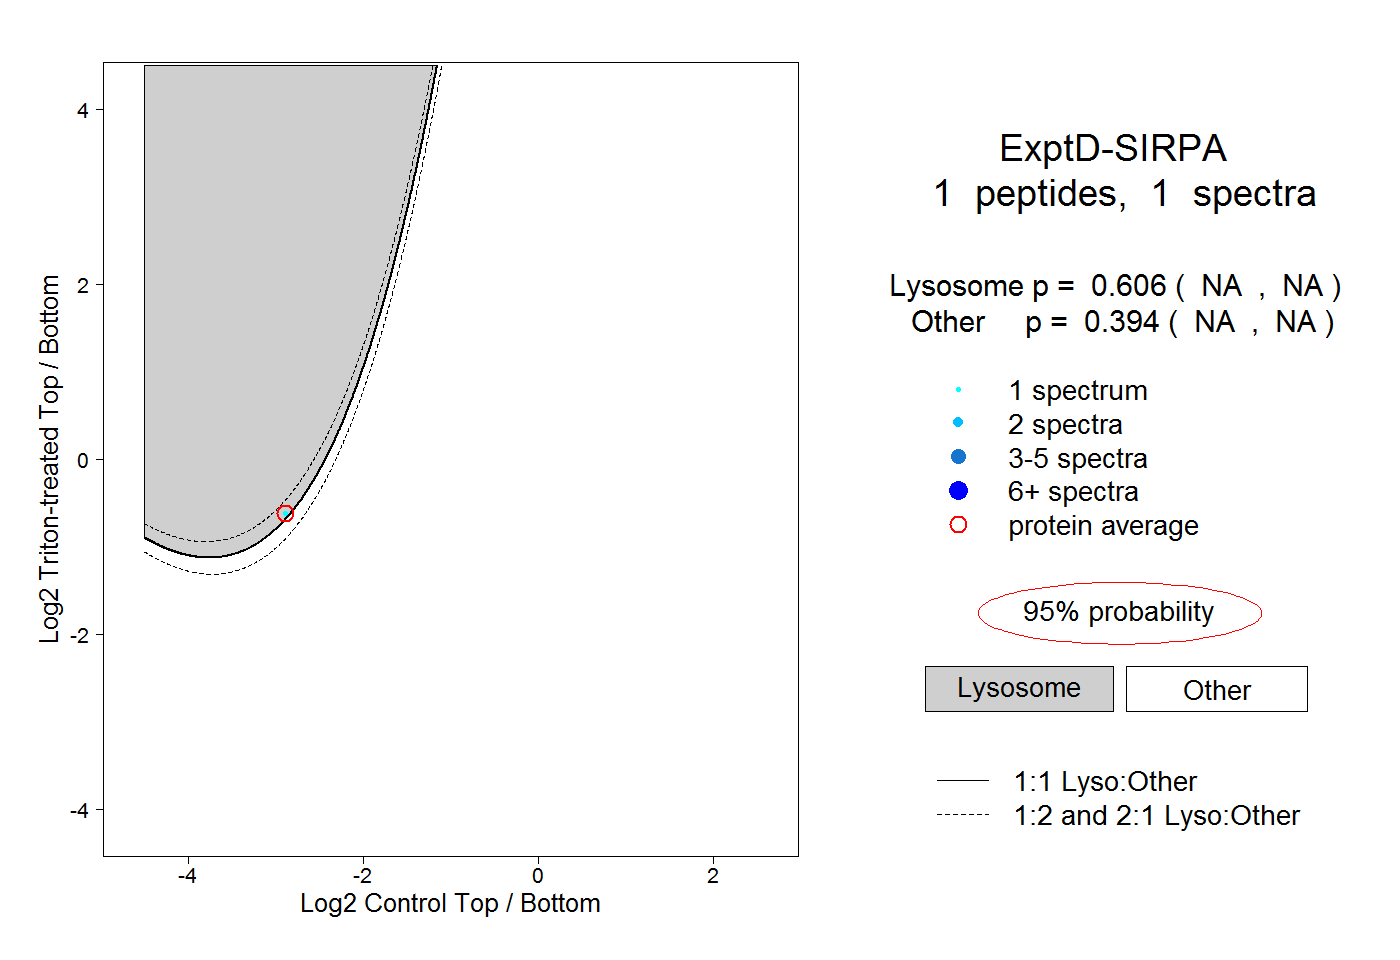
NA | NA
NA | NA