 3
3peptides
spectra
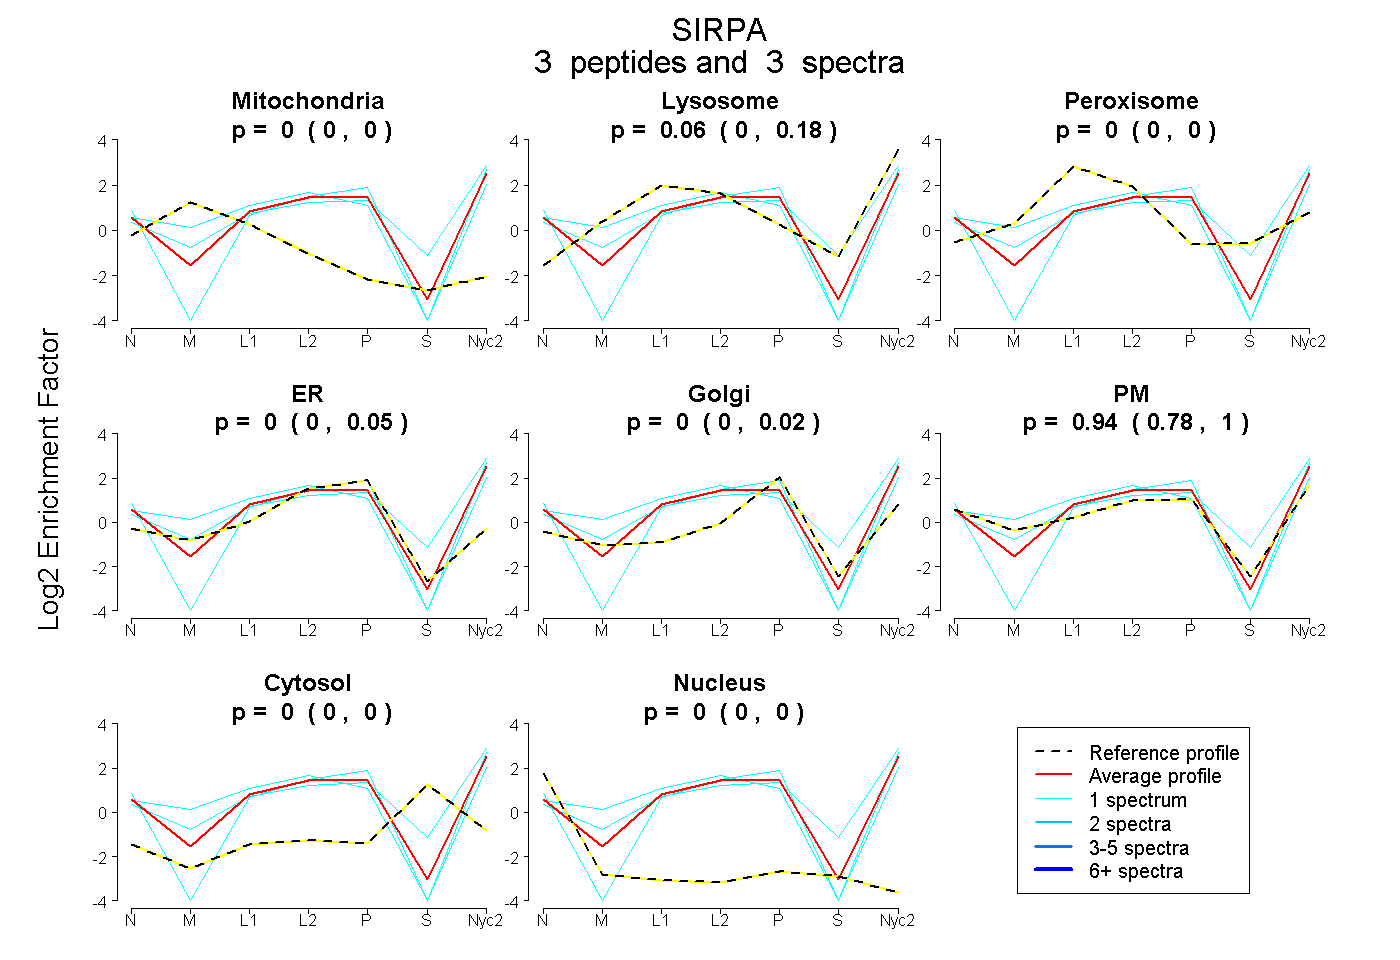
0.000 | 0.000
0.000 | 0.182
0.000 | 0.000
0.000 | 0.052
0.000 | 0.025
0.783 | 1.000
0.000 | 0.000
0.000 | 0.000
| Plot | Mito | Lyso | Perox | ER | Golgi | PM | Cytosol | Nucleus | |||||
| Expt A |
3 peptides |
3 spectra |
|
0.000 0.000 | 0.000 |
0.065 0.000 | 0.182 |
0.000 0.000 | 0.000 |
0.000 0.000 | 0.052 |
0.000 0.000 | 0.025 |
0.935 0.783 | 1.000 |
0.000 0.000 | 0.000 |
0.000 0.000 | 0.000 |
| 1 spectrum, LHEPEK | 0.000 | 0.000 | 0.000 | 0.003 | 0.187 | 0.810 | 0.000 | 0.000 | ||
| 1 spectrum, SPIYSFIGGEHFPR | 0.000 | 0.070 | 0.000 | 0.000 | 0.000 | 0.930 | 0.000 | 0.000 | ||
| 1 spectrum, VSPTLK | 0.000 | 0.345 | 0.000 | 0.000 | 0.000 | 0.629 | 0.026 | 0.000 |
| Plot | Lyso | Other | |||||||||||
| Expt C |
7 peptides |
13 spectra |
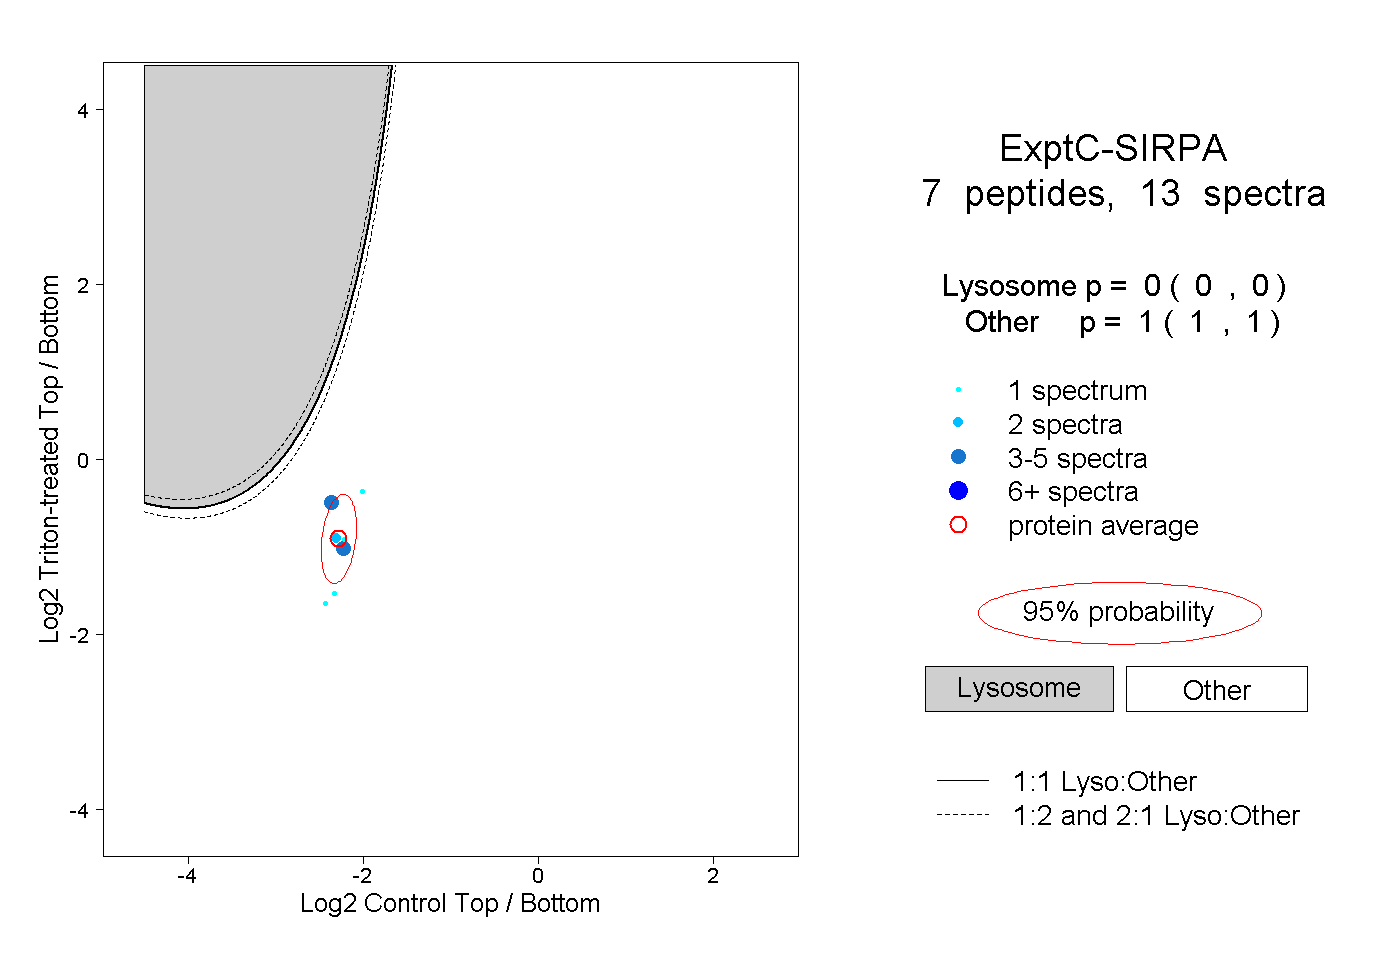 |
0.000 0.000 | 0.000 |
1.000 1.000 | 1.000 |
||||||||
| Plot | Lyso | Other | |||||||||||
| Expt D |
1 peptide |
1 spectrum |
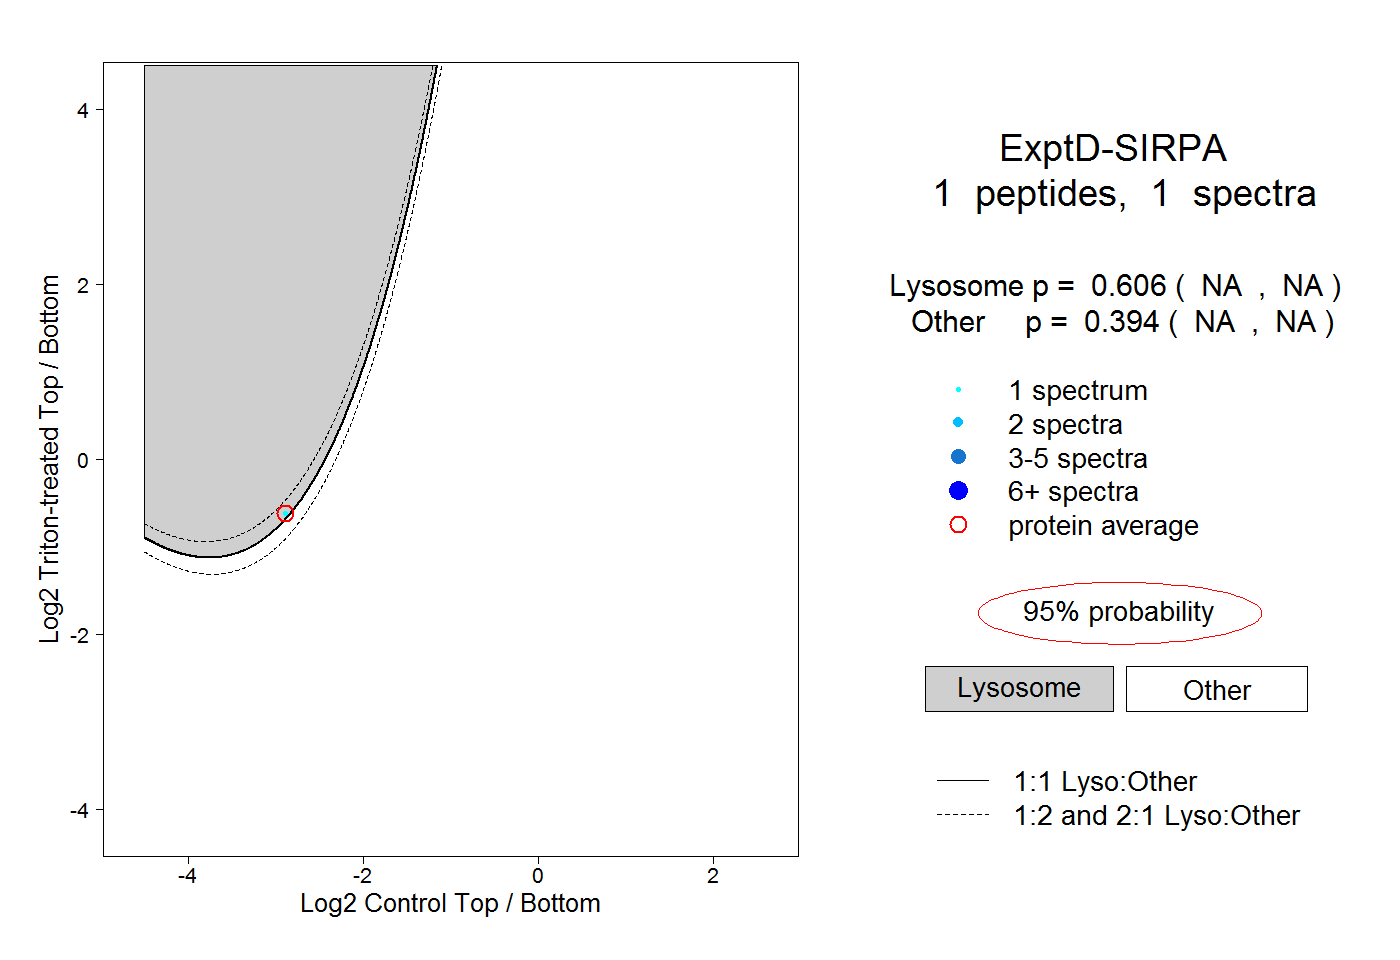 |
0.606 NA | NA |
0.394 NA | NA |