 19
19peptides
spectra
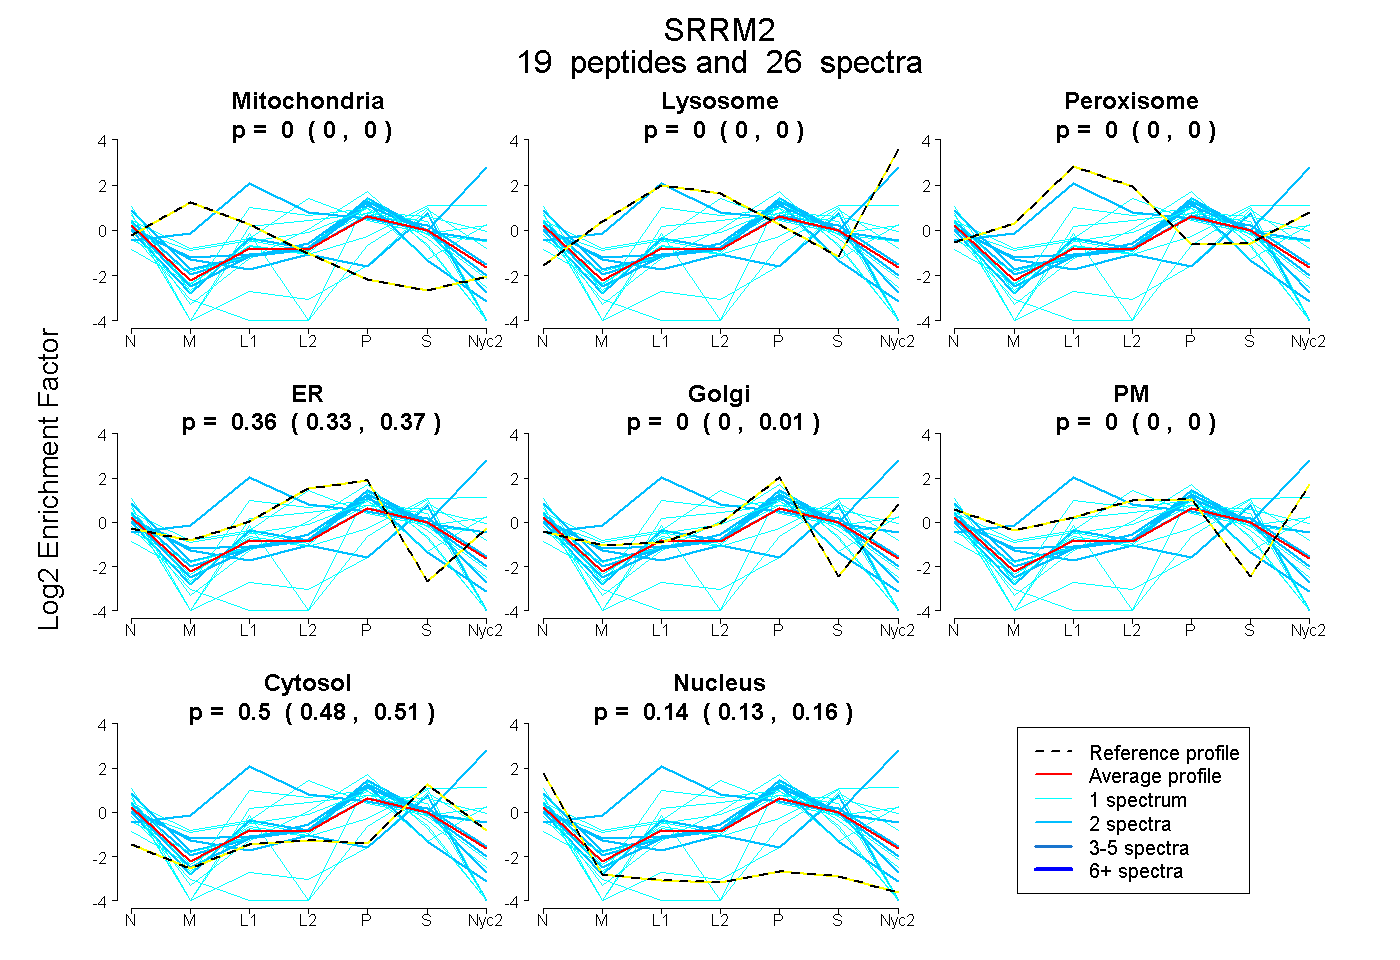
0.000 | 0.000
0.000 | 0.000
0.000 | 0.000
0.334 | 0.372
0.000 | 0.011
0.000 | 0.000
0.483 | 0.509
0.127 | 0.157
4peptides
spectra
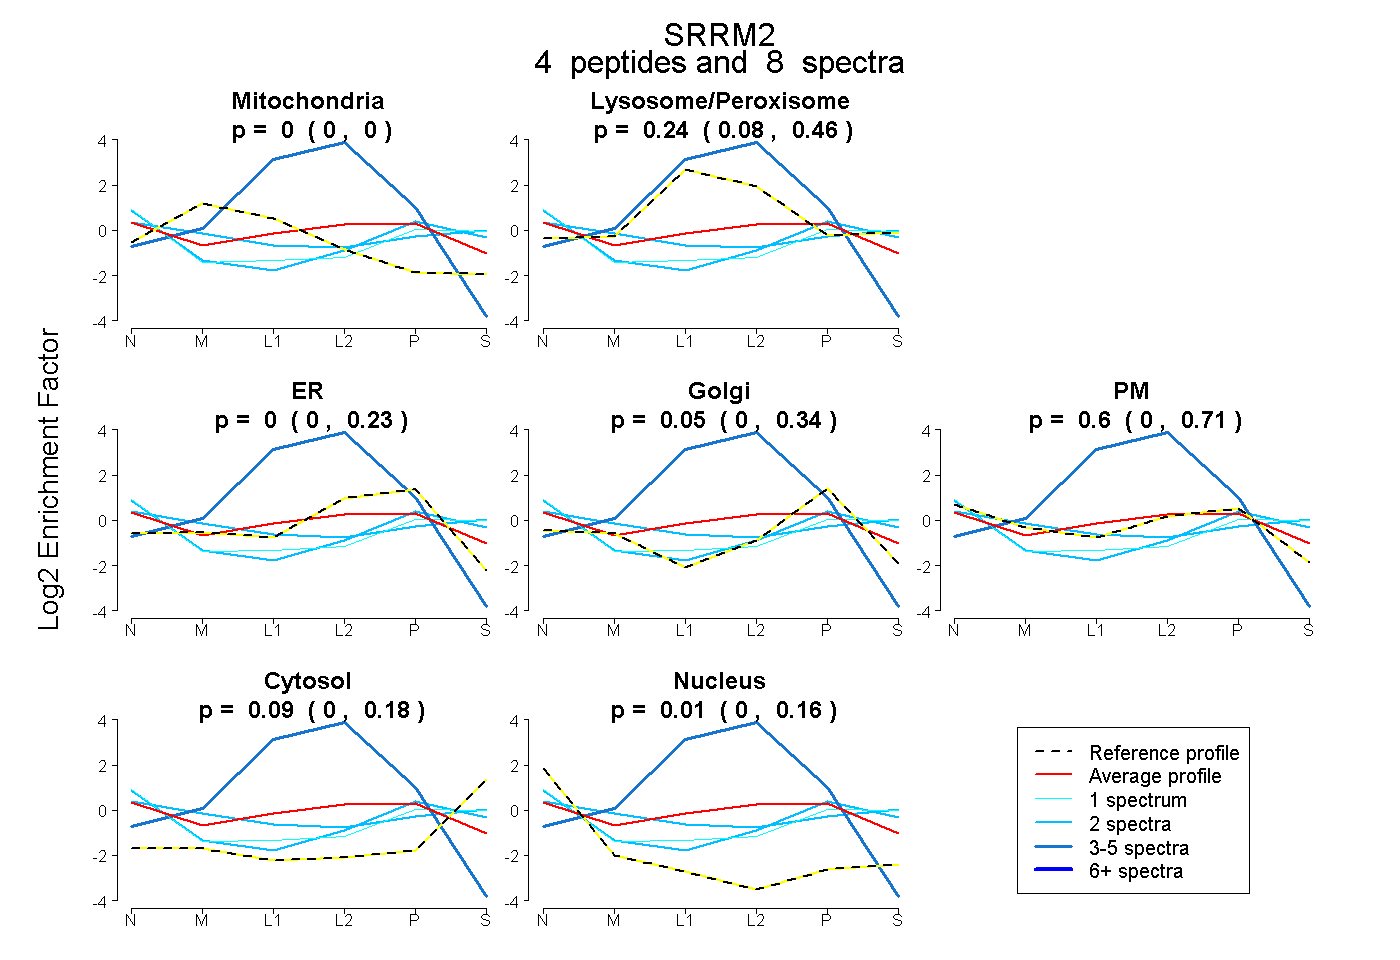
0.000 | 0.000
0.081 | 0.462
0.000 | 0.231
0.000 | 0.339
0.000 | 0.705
0.000 | 0.179
0.000 | 0.164
5peptides
spectra
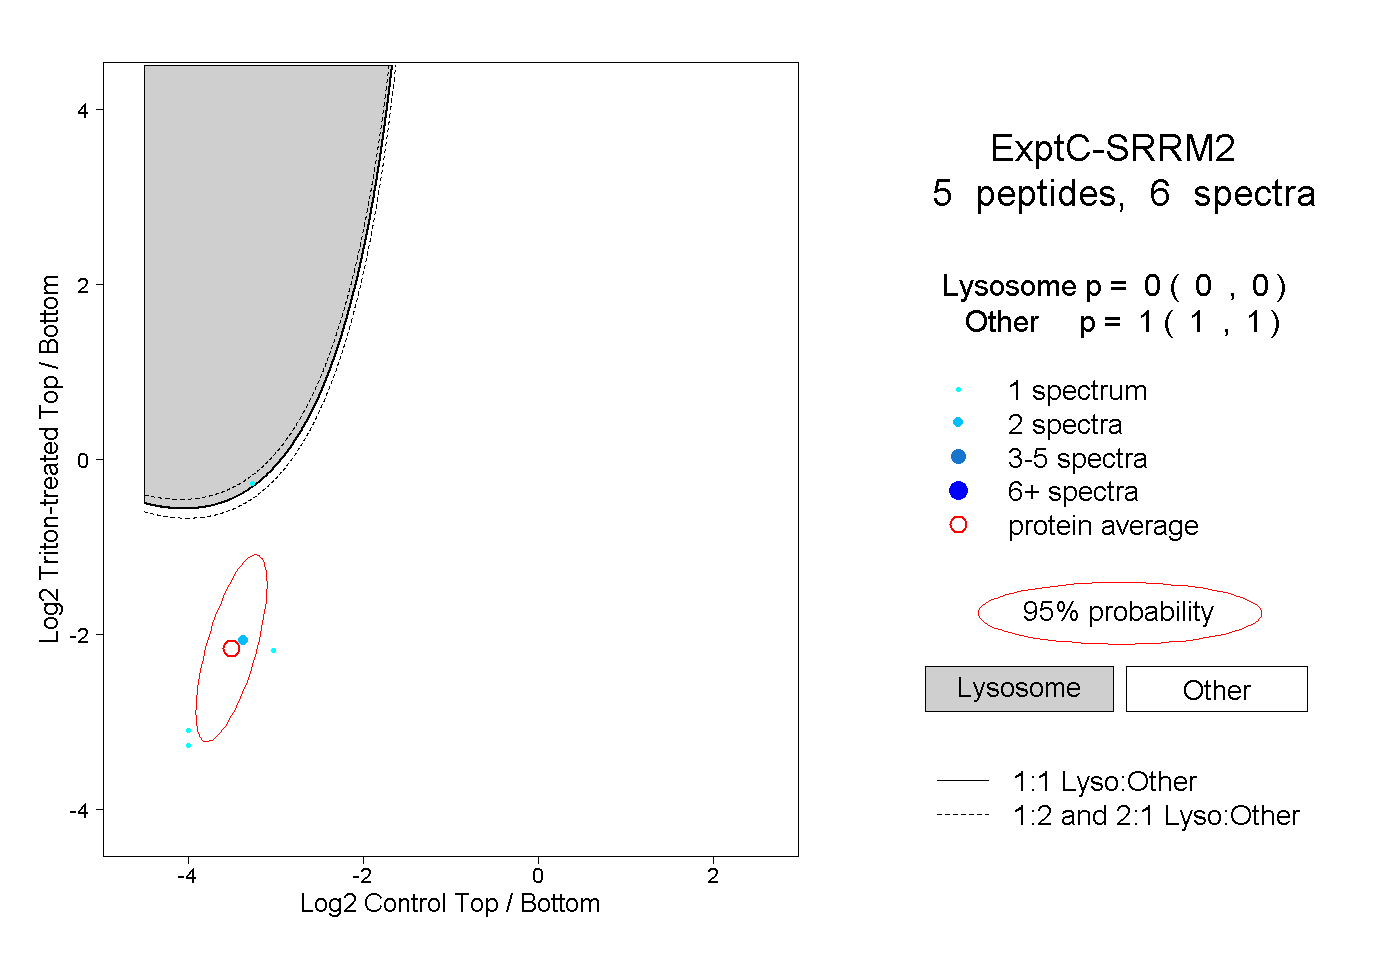
0.000 | 0.000
1.000 | 1.000