SRRM2
[ENSRNOP00000006370]
Main page
| | | Plot |
Mito |
Lyso |
|
Perox |
ER |
Golgi |
PM |
Cytosol |
Nucleus |
|
| Expt A |
 19
19
peptides |
26
spectra |
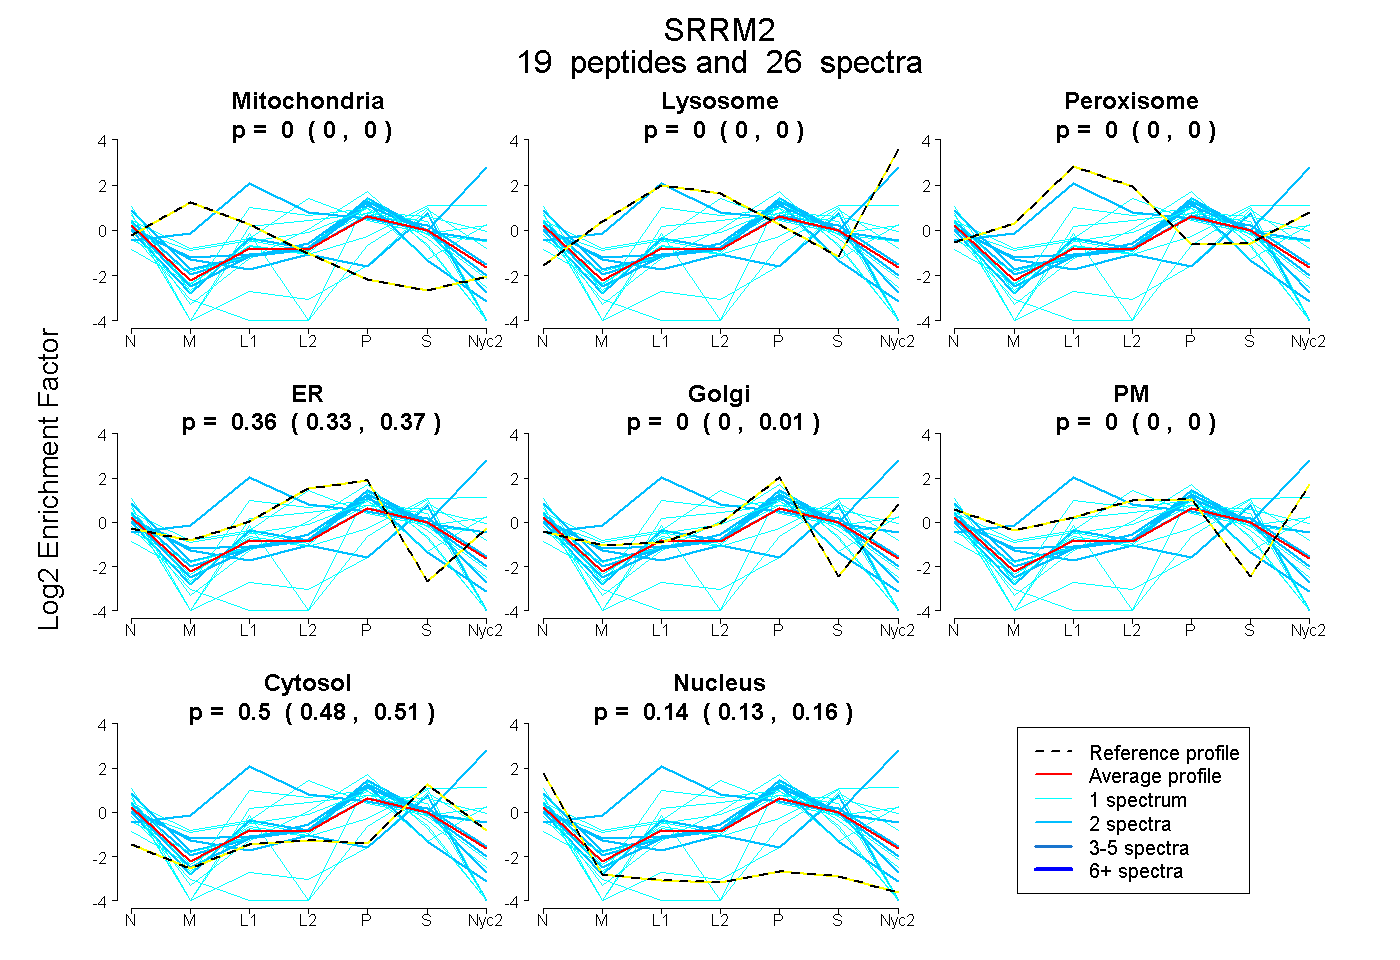 |
0.000
0.000 | 0.000 |
0.000
0.000 | 0.000 |
|
0.000
0.000 | 0.000 |
0.360
0.334 | 0.372 |
0.000
0.000 | 0.011 |
0.000
0.000 | 0.000 |
0.497
0.483 | 0.509 |
0.143
0.127 | 0.157 |
|
| | | Plot |
Mito |
|
Lyso or Perox |
|
ER |
Golgi |
PM |
Cytosol |
Nucleus |
|
| Expt B |
4
peptides |
8
spectra |
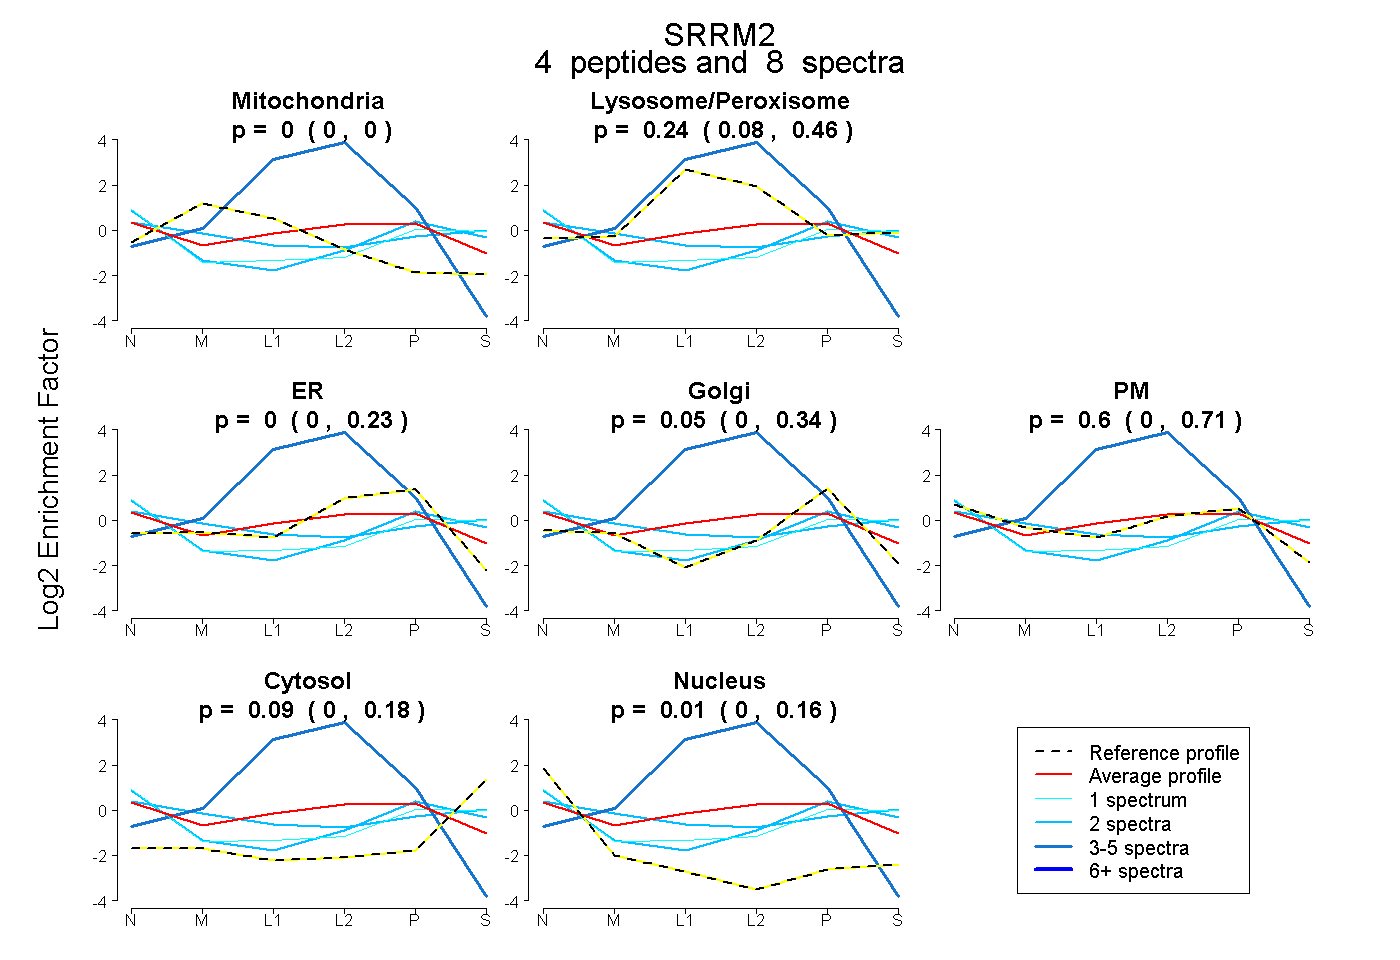 |
0.000
0.000 | 0.000 |
|
0.240
0.081 | 0.462 |
|
0.000
0.000 | 0.231 |
0.053
0.000 | 0.339 |
0.601
0.000 | 0.705 |
0.091
0.000 | 0.179 |
0.014
0.000 | 0.164 |
|
| 1 spectrum, TPLTSR |
0.000 |
|
0.012 |
|
0.000 |
0.000 |
0.545 |
0.332 |
0.111 |
|
| 3 spectra, TPLLSR |
0.000 |
|
0.682 |
|
0.318 |
0.000 |
0.000 |
0.000 |
0.000 |
|
| 2 spectra, RPNPDILDHER |
0.053 |
|
0.133 |
|
0.000 |
0.000 |
0.482 |
0.320 |
0.012 |
|
| 2 spectra, NLSLVR |
0.000 |
|
0.000 |
|
0.000 |
0.133 |
0.519 |
0.264 |
0.084 |
|
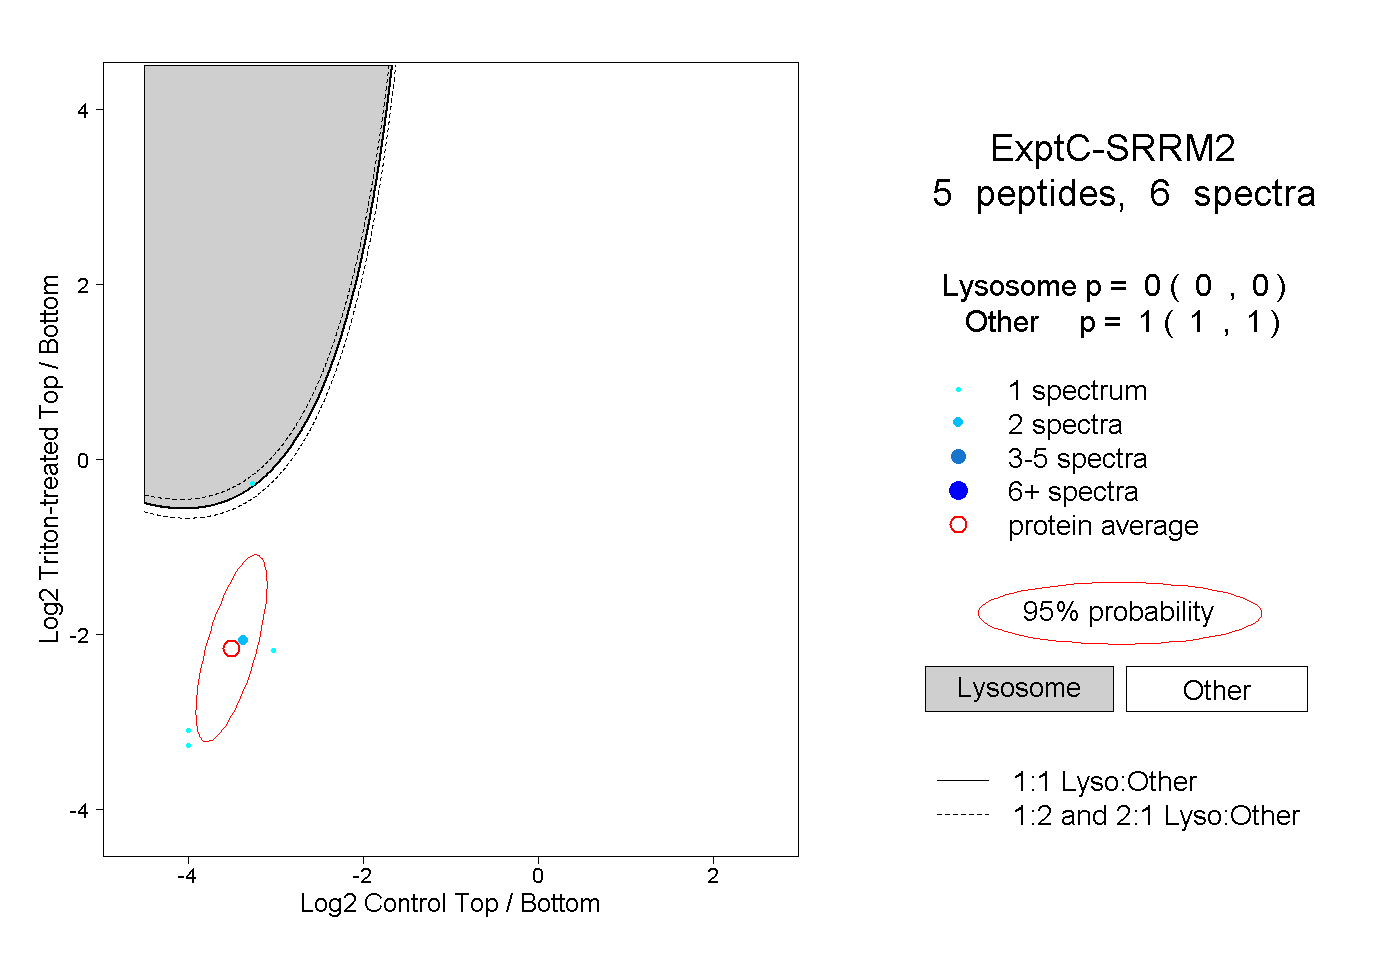
| | | Plot |
|
Lyso |
|
|
|
|
|
|
|
Other |
| Expt C |
5
peptides |
6
spectra |
 |
|
0.000
0.000 | 0.000 |
|
|
|
|
|
|
|
1.000
1.000 | 1.000 |